Case Study · 2025 — Present

TruDiagnostic

Creative Direction · Brand

Web · UI/UX

Growth · Campaign

Provider · Print

Building a connected visual system for precision health.

TruDiagnostic homepage on a laptop — “A New Era of Medicine Powered by Epigenetics”
Campaign — Rose fade. Signal don't.
Black Friday — A better gift for your future self
Mobile — report experience
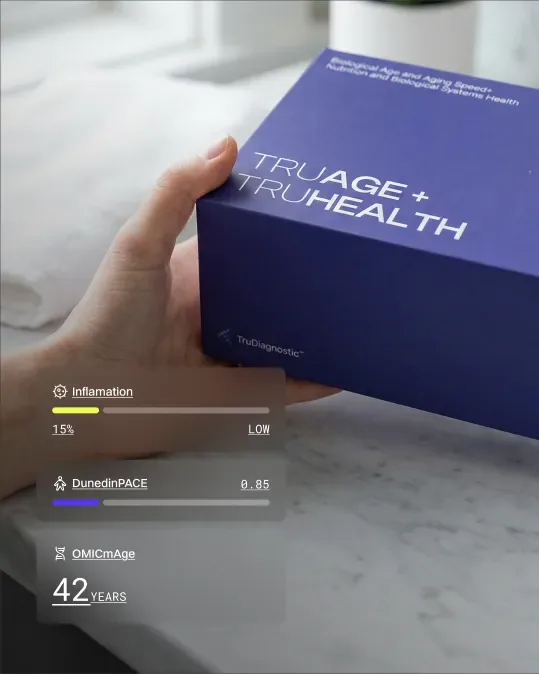
Brand visual — glass overlay with data callout
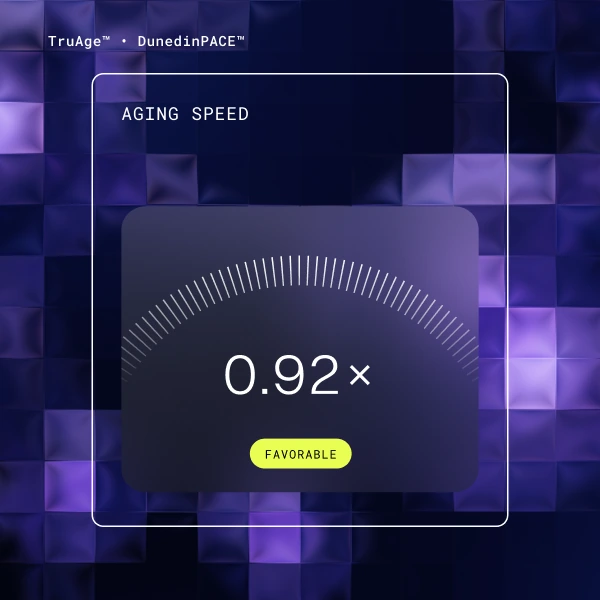
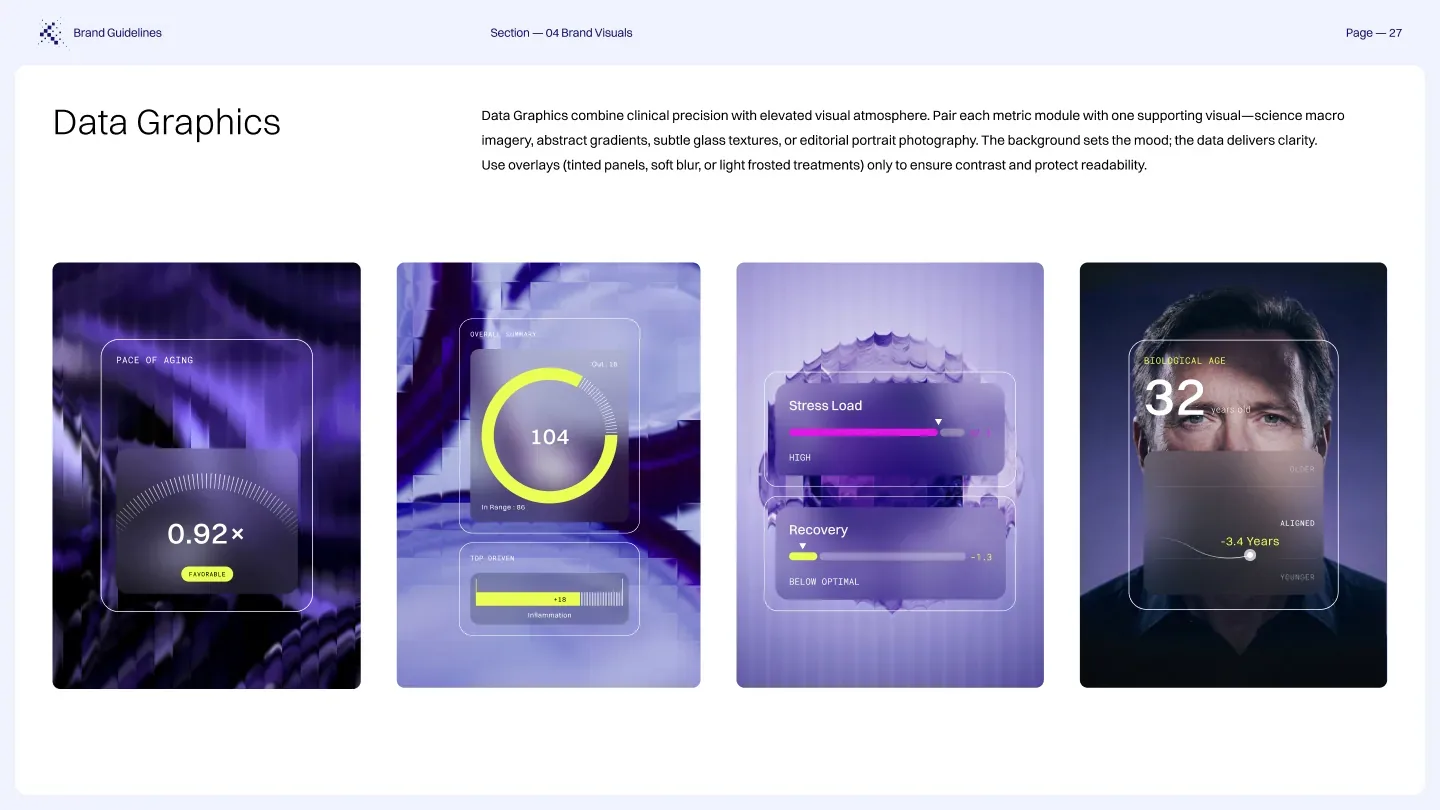
Report module — aging speed 0.92×
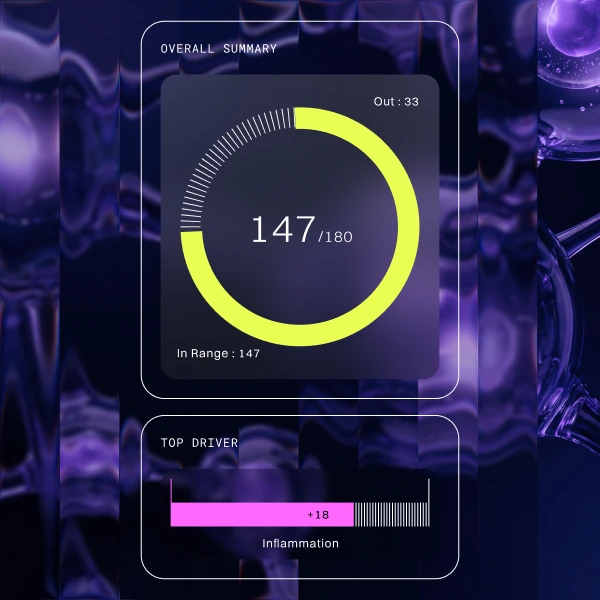
Report module — overall summary 147/180

Overview

TruDiagnostic translates complex epigenetic science into tools that help people and healthcare providers better understand biological aging and health.

My work spanned the brand's full ecosystem — from visual identity and digital experience to provider marketing, lifecycle, campaigns, reports, paid media, and physical touchpoints.

The challenge was creating enough consistency for the brand to feel recognizable everywhere while allowing each audience and channel to work differently.

Creative Direction

Visual Design

Brand Systems

Web Design

UI/UX

Growth

HCP Marketing

Campaigns

Paid & Social

Lifecycle

Reports

Print & Conference

One system.

Many touchpoints.

01

Evolving the brand system

The visual system evolved toward a more precise, clinical, and premium expression while retaining enough energy to work across consumer, provider, and growth channels.

It was designed to scale — not simply to provide a set of rules.
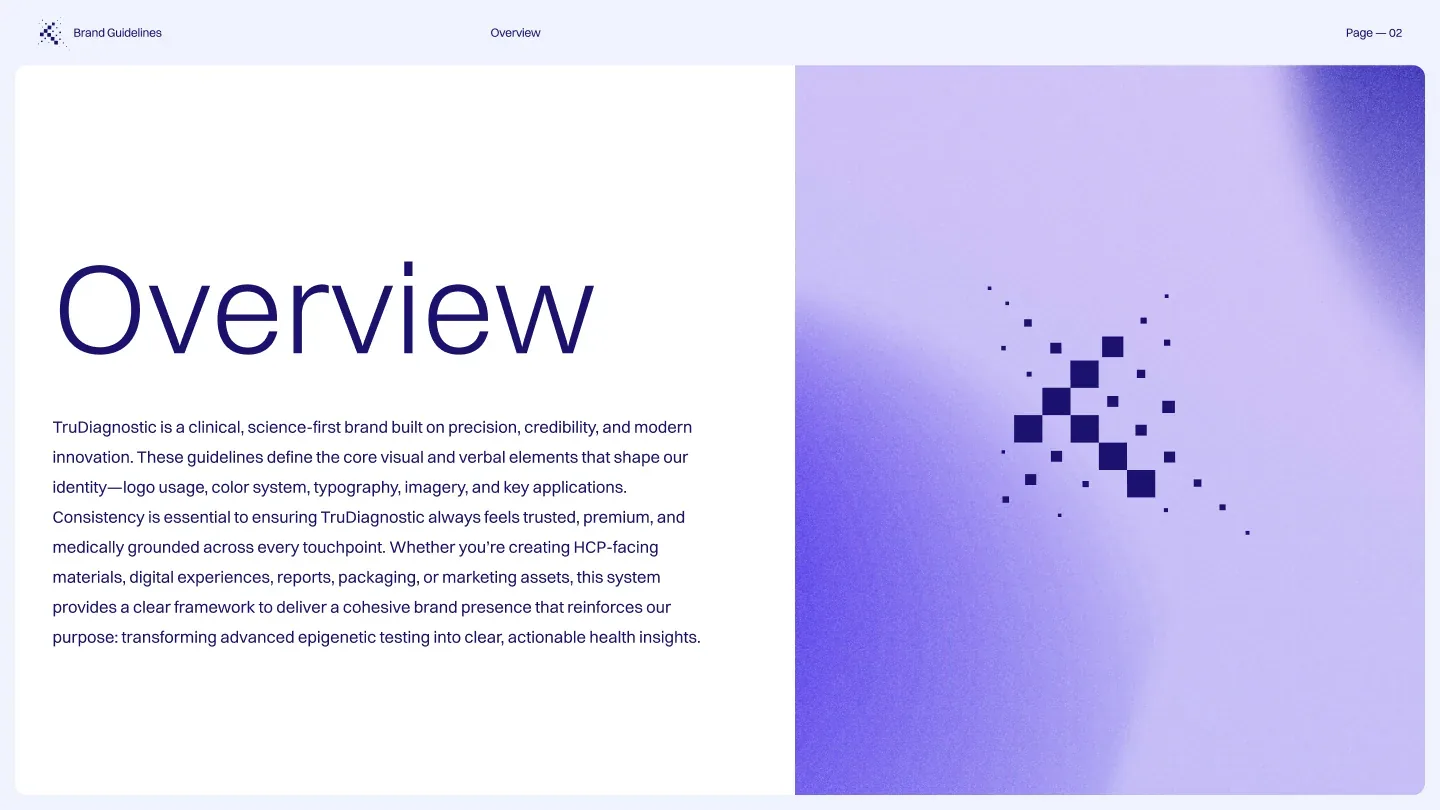
Brand guidelines — overview
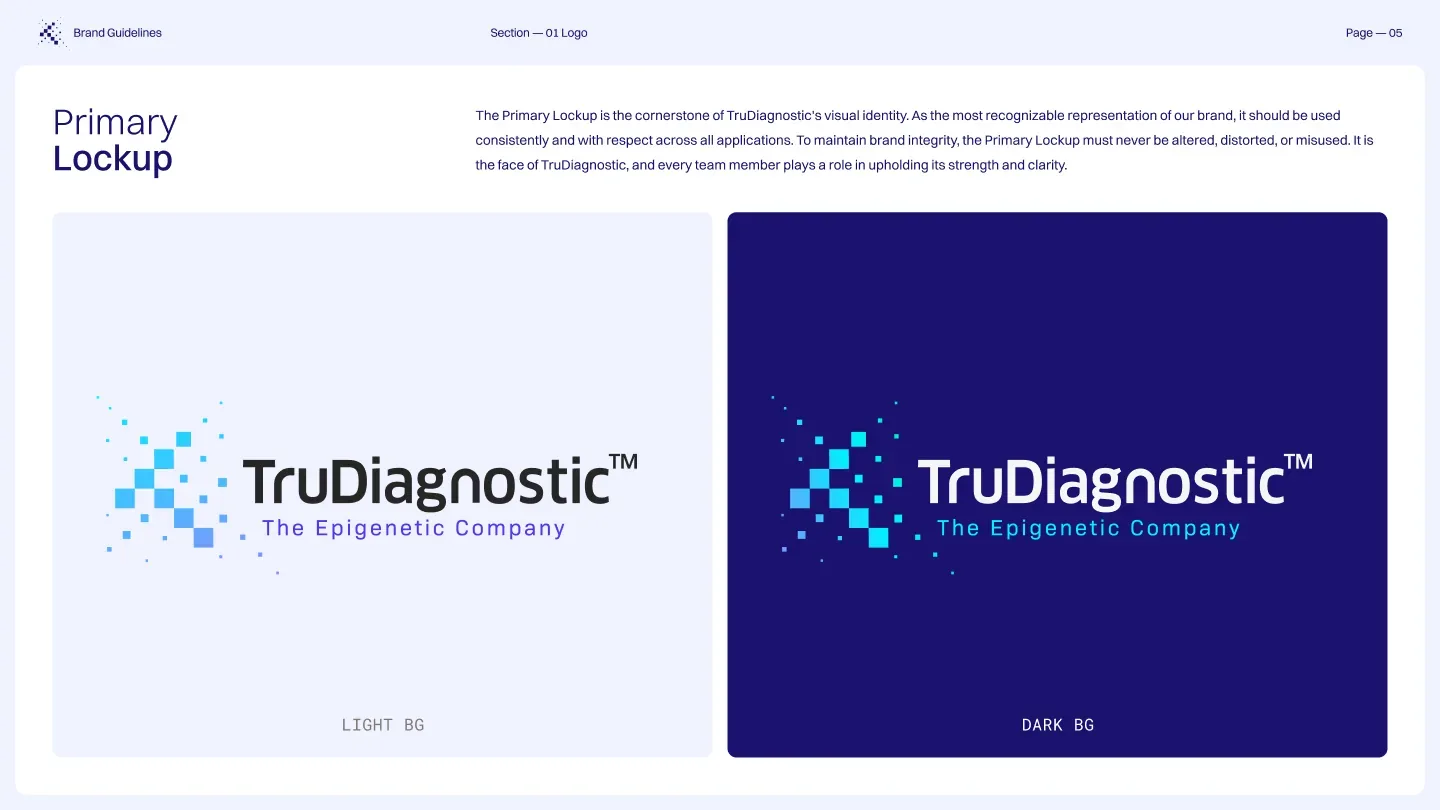
Primary lockup on light and indigo
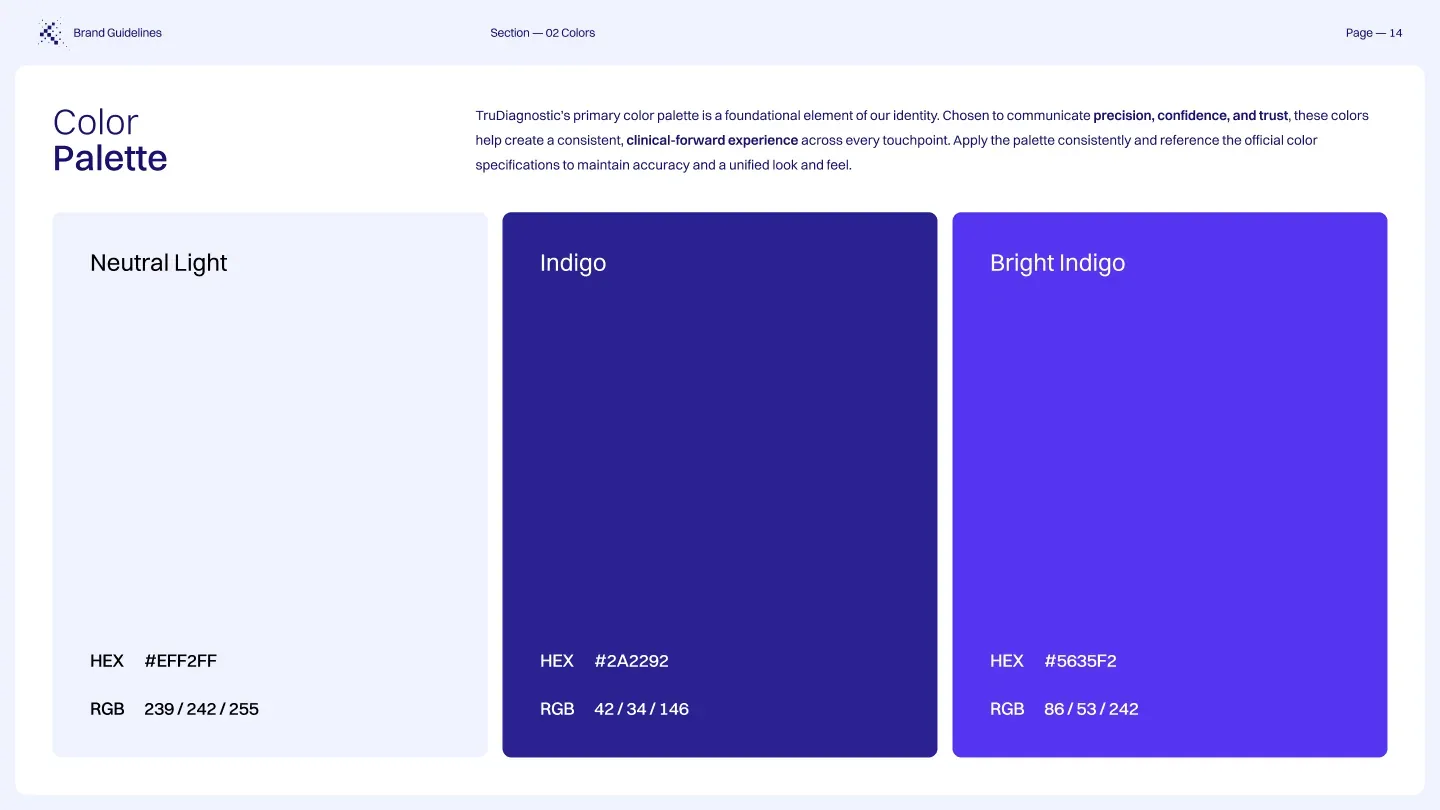
Core colour palette
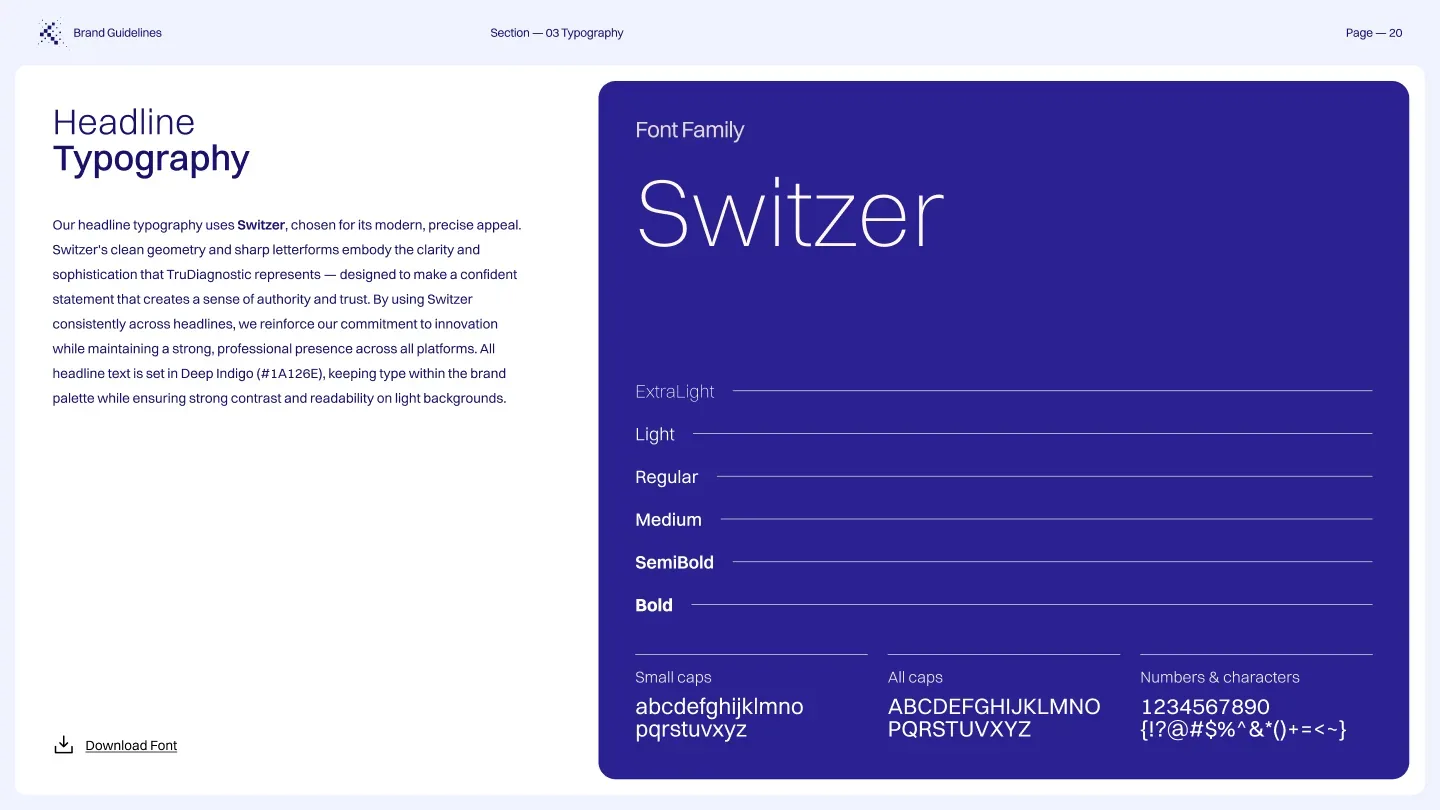
Typography — Switzer
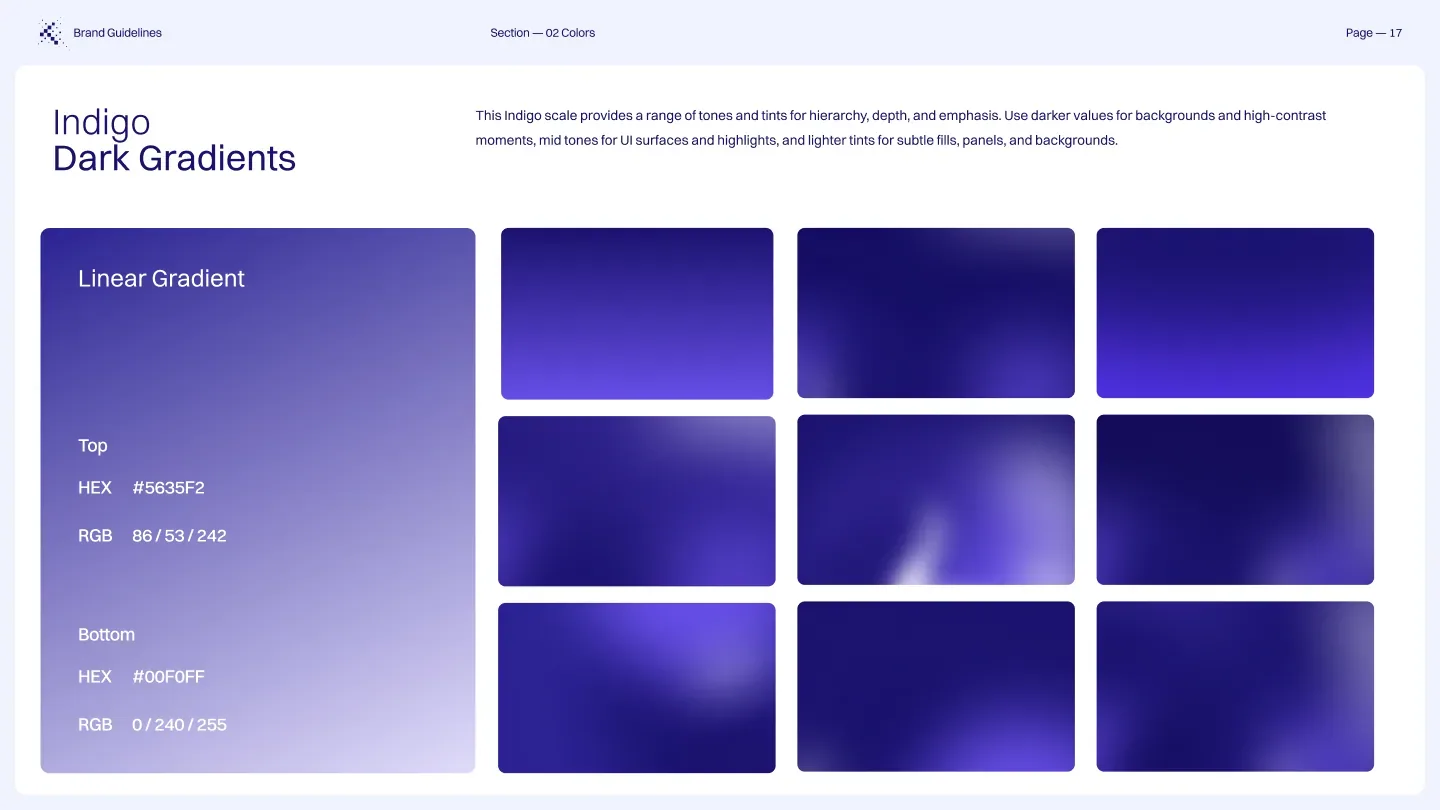
Indigo gradients
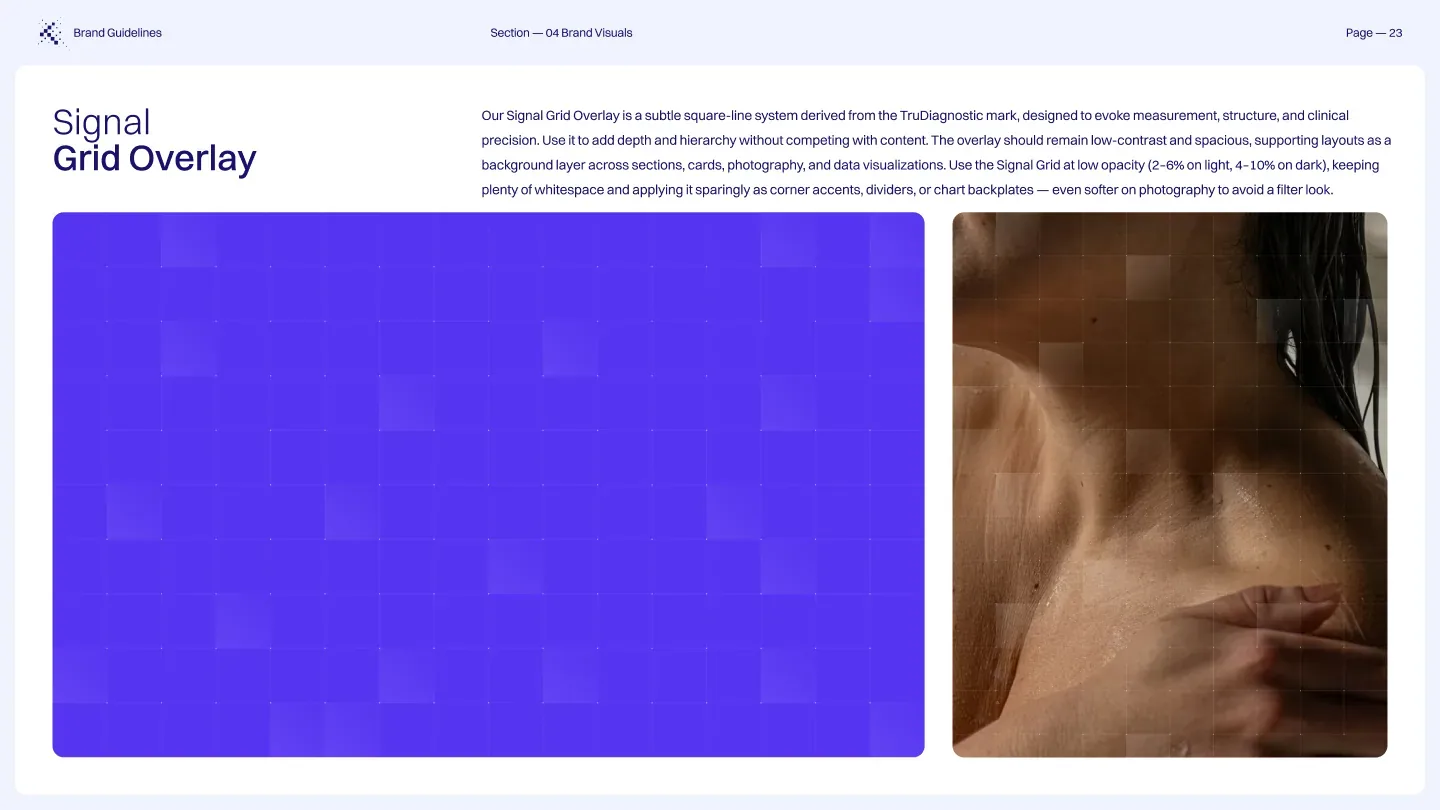
Signal grid overlay
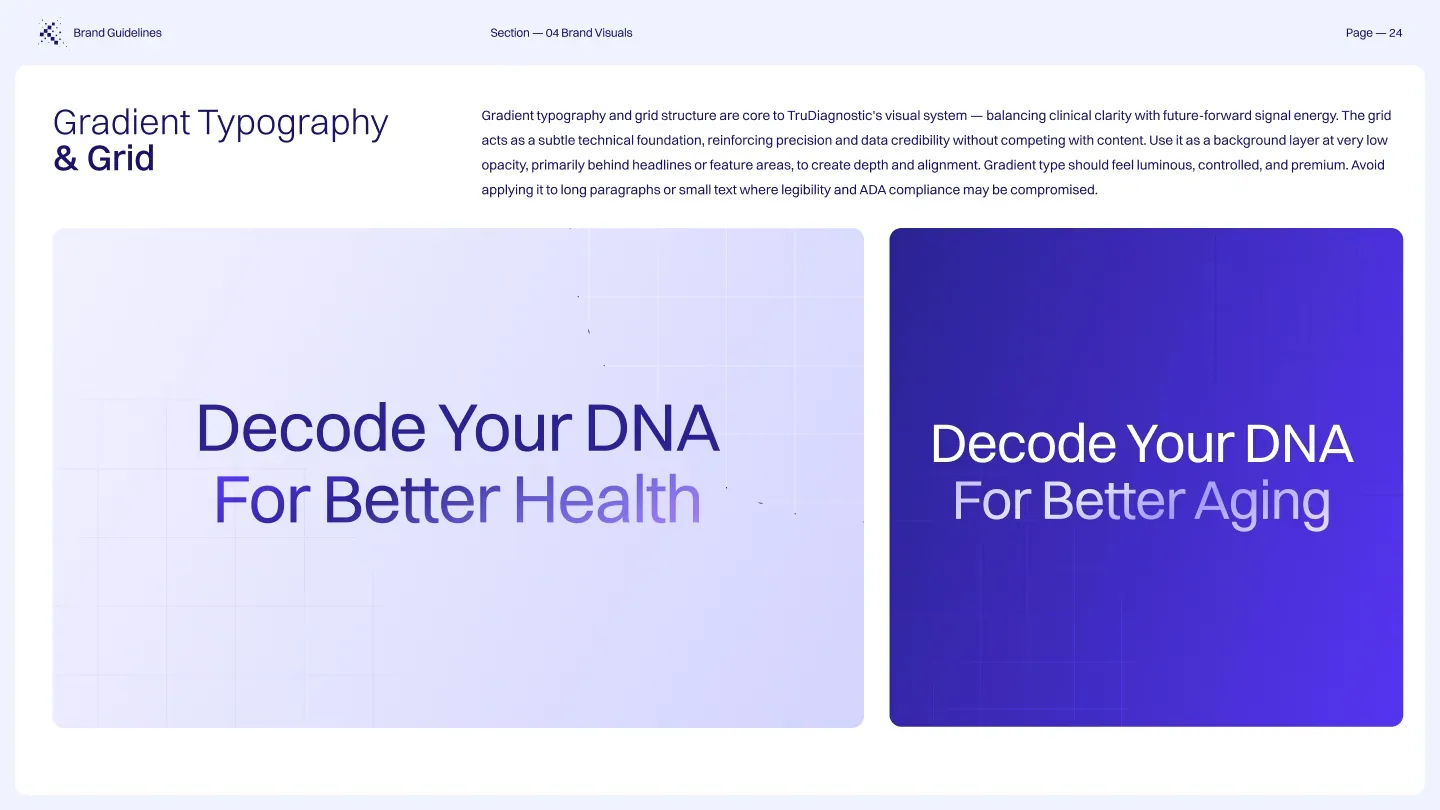
Gradient typography
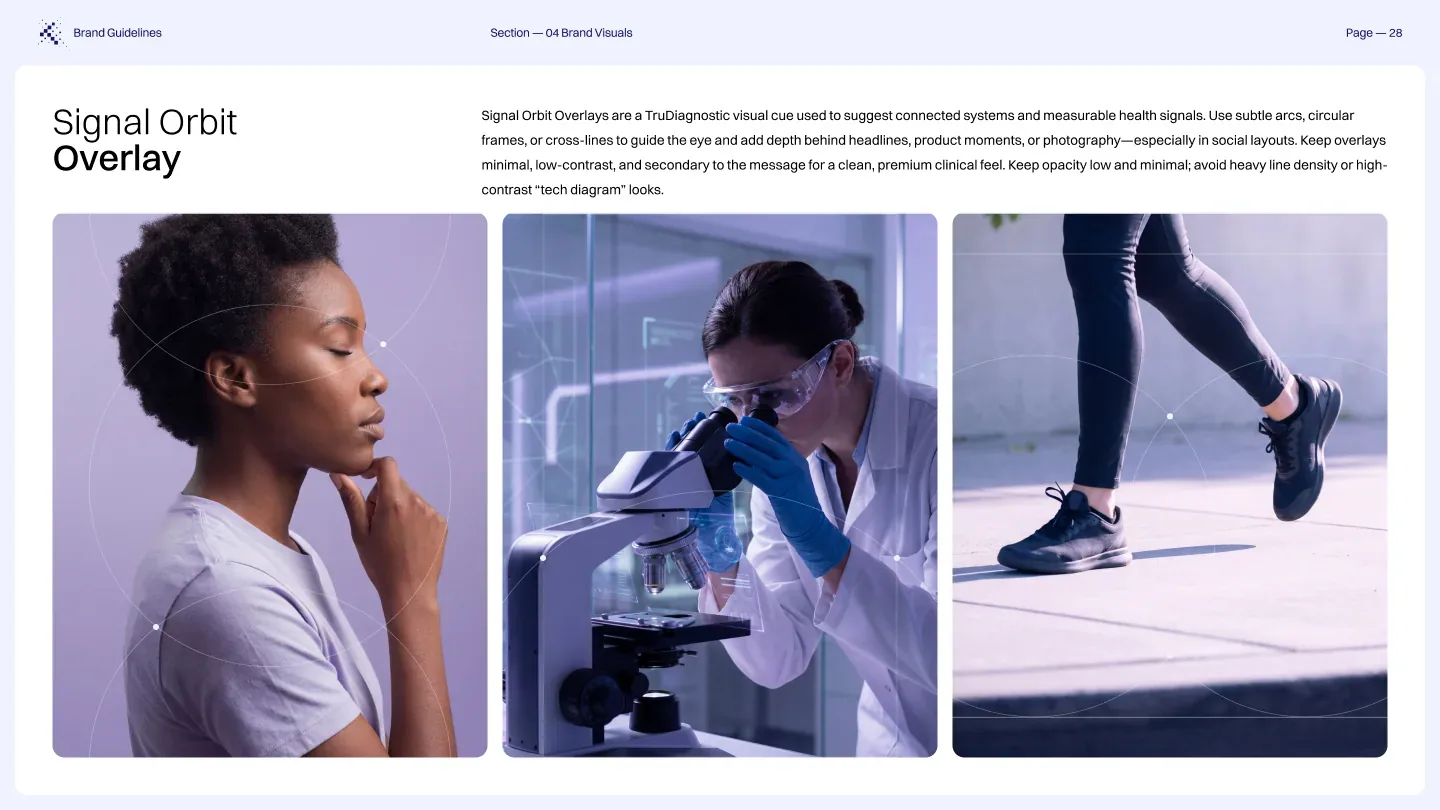
Signal orbit overlay
Data graphics
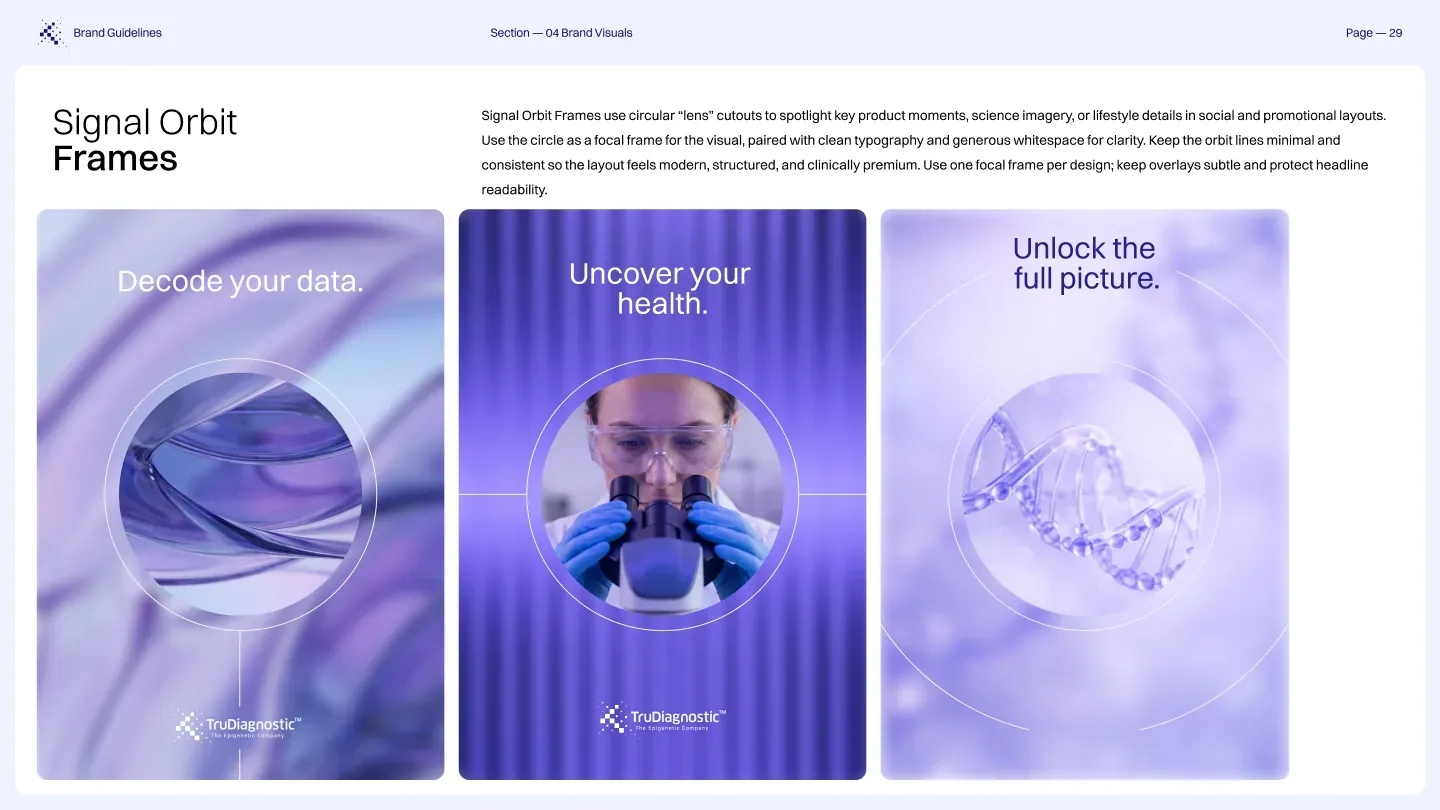
Signal orbit frames
Photography direction

02

Digital experience

The digital experience needed to make a complicated scientific offering feel approachable without oversimplifying it.

Clear hierarchy, modular storytelling, and stronger product communication connect the science with what people actually receive and understand.

TruDiagnostic homepage, updated — full page. Hover to scroll.

Homepage — full pageHover to scroll
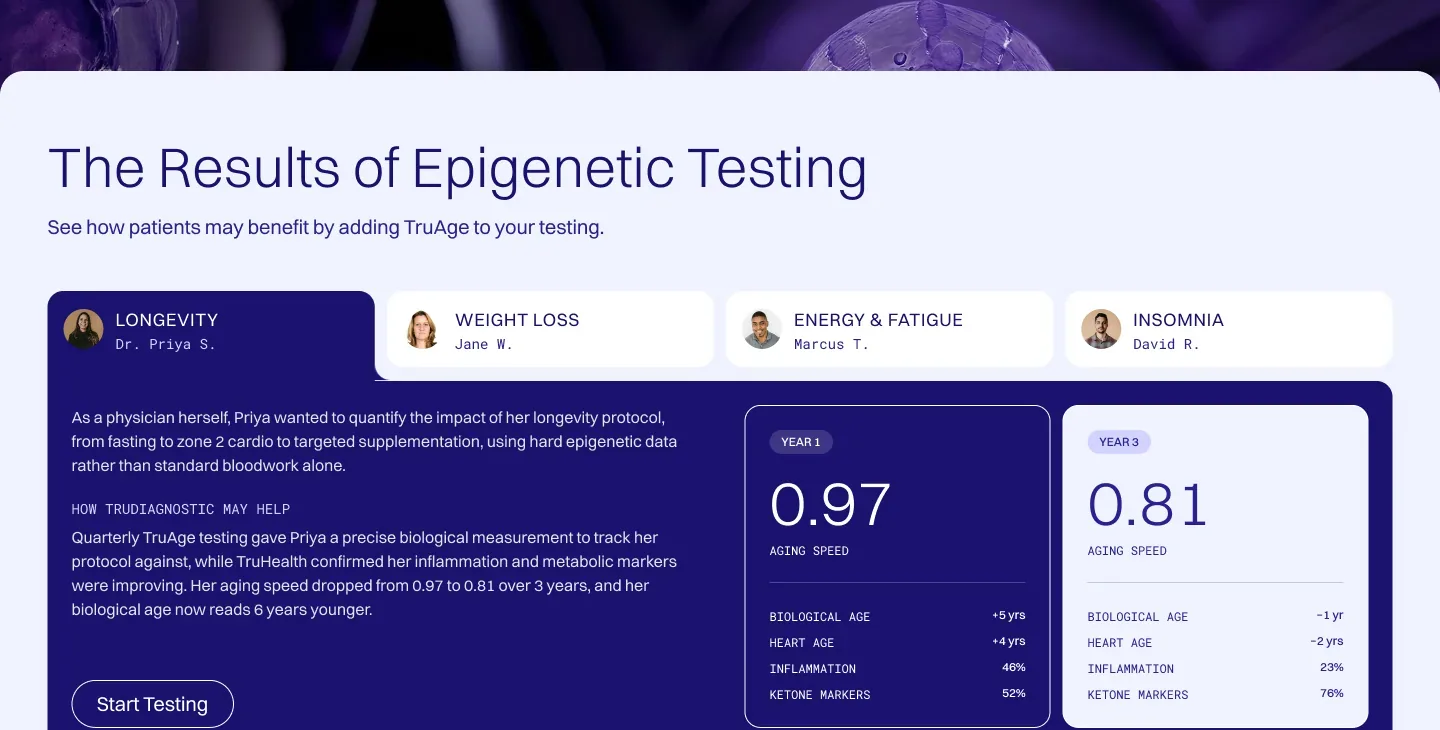
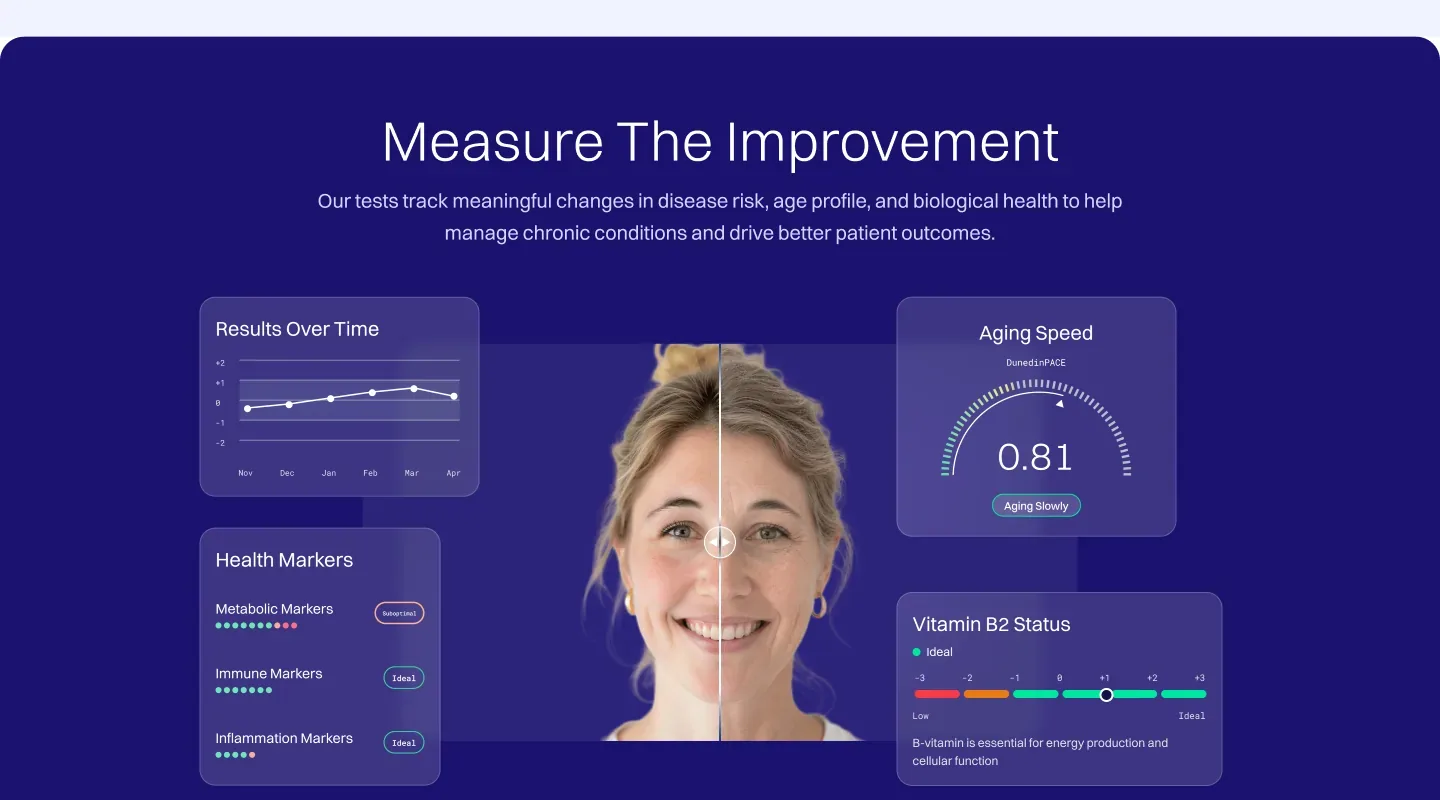
Measure the improvement — data UI module
Results of epigenetic testing — patient tabs
New storefront — “Your health, decoded.” Full page. Hover to scroll.

Storefront — newHover to scroll

Product page — TruAge + TruHealth Combination Kit. Full page. Hover to scroll.

Product page — TruAge + TruHealthHover to scroll
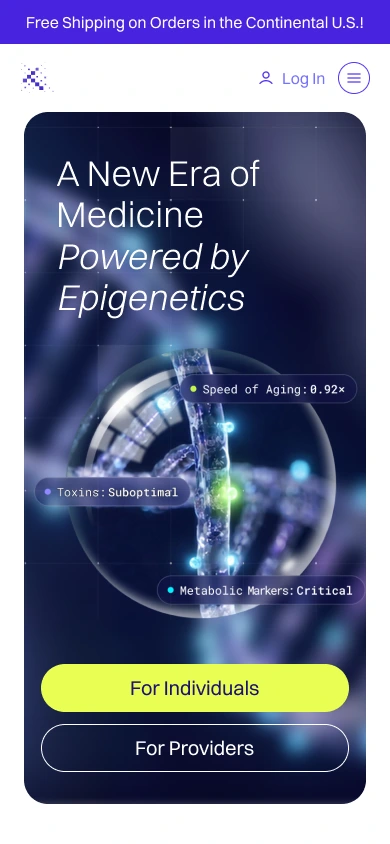
Mobile — homepage
Mobile — storefront
Mobile — become a provider
Mobile — report education
Mobile — about TruAge
Become a provider page
Report education page
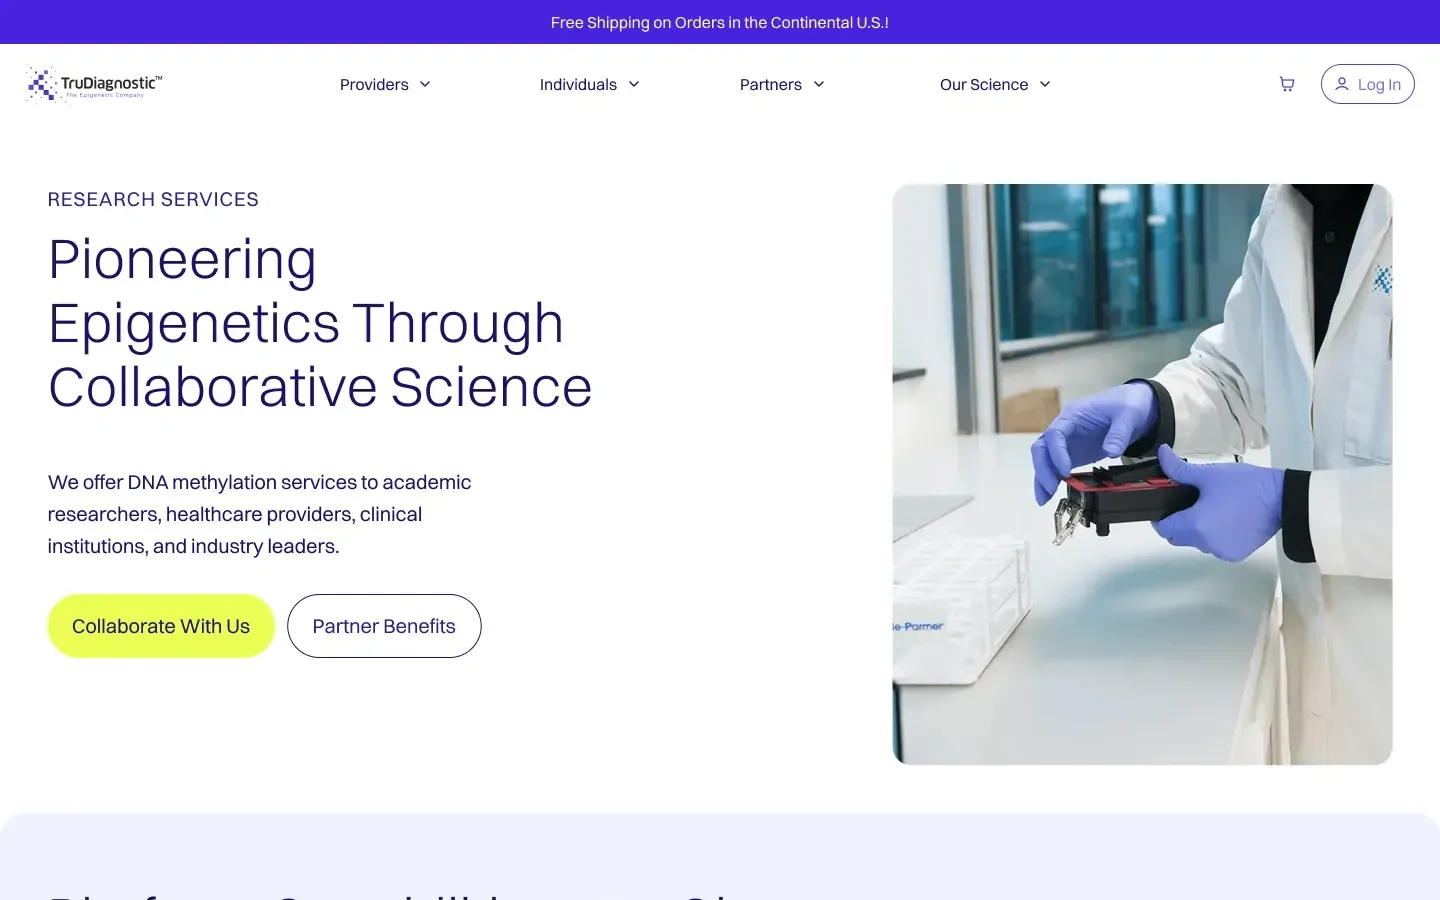
Research services page
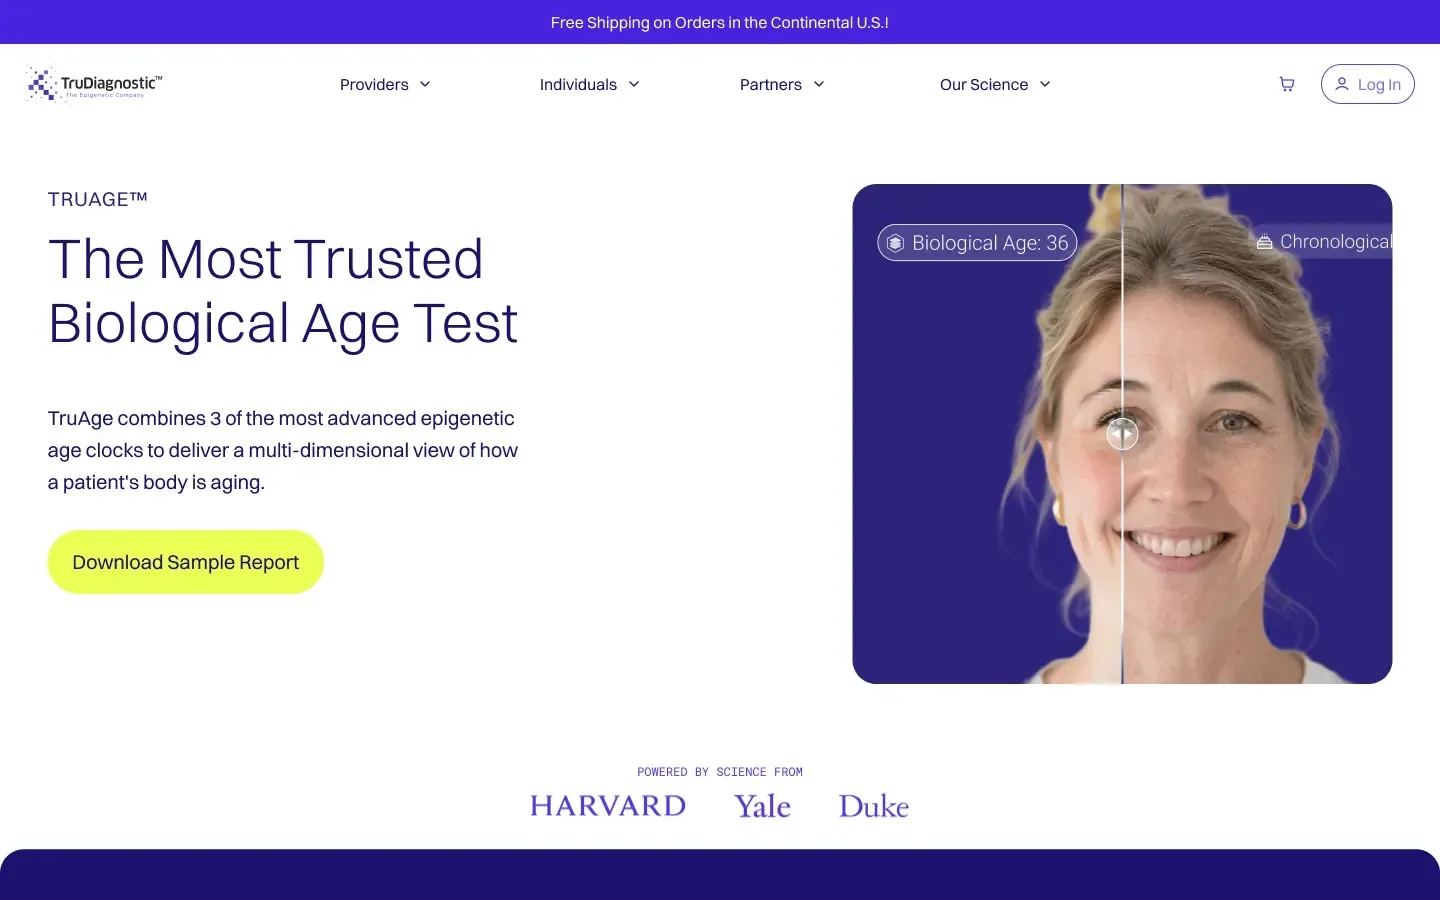
About TruAge page
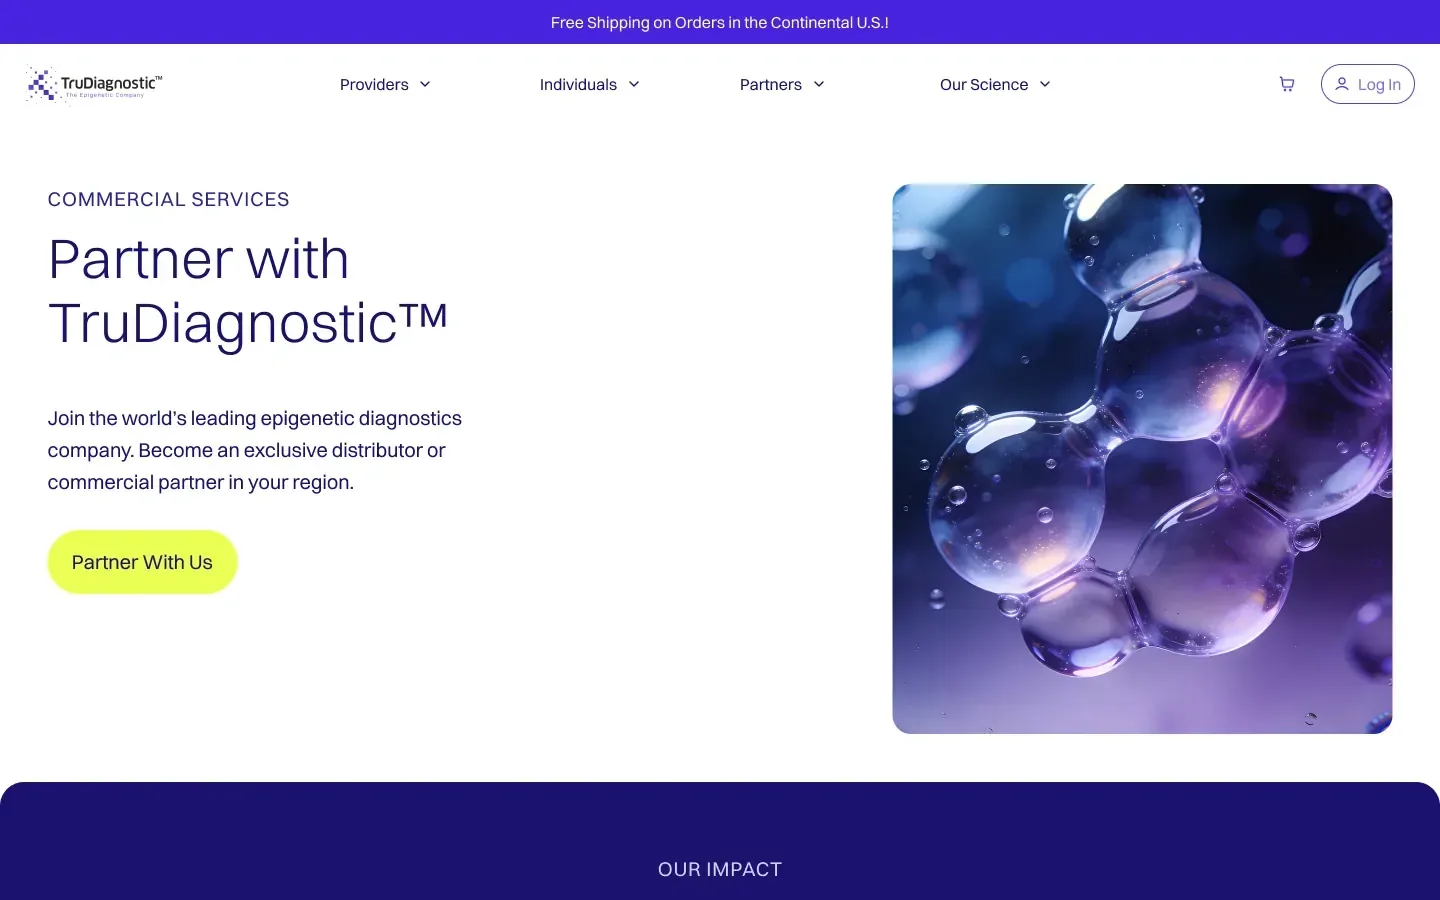
Commercial services page

03

Provider & sales print

Healthcare providers needed a different communication system from direct-to-consumer audiences — more structured, evidence-led, and implementation-focused.

A family of print tools gives field teams and clinics one consistent way to explain the science and bring testing into practice.

Clinical visual aid — “See What Serum Can’t” cover

Clinical visual aid — saddle-stitched bookletField sales · clinics
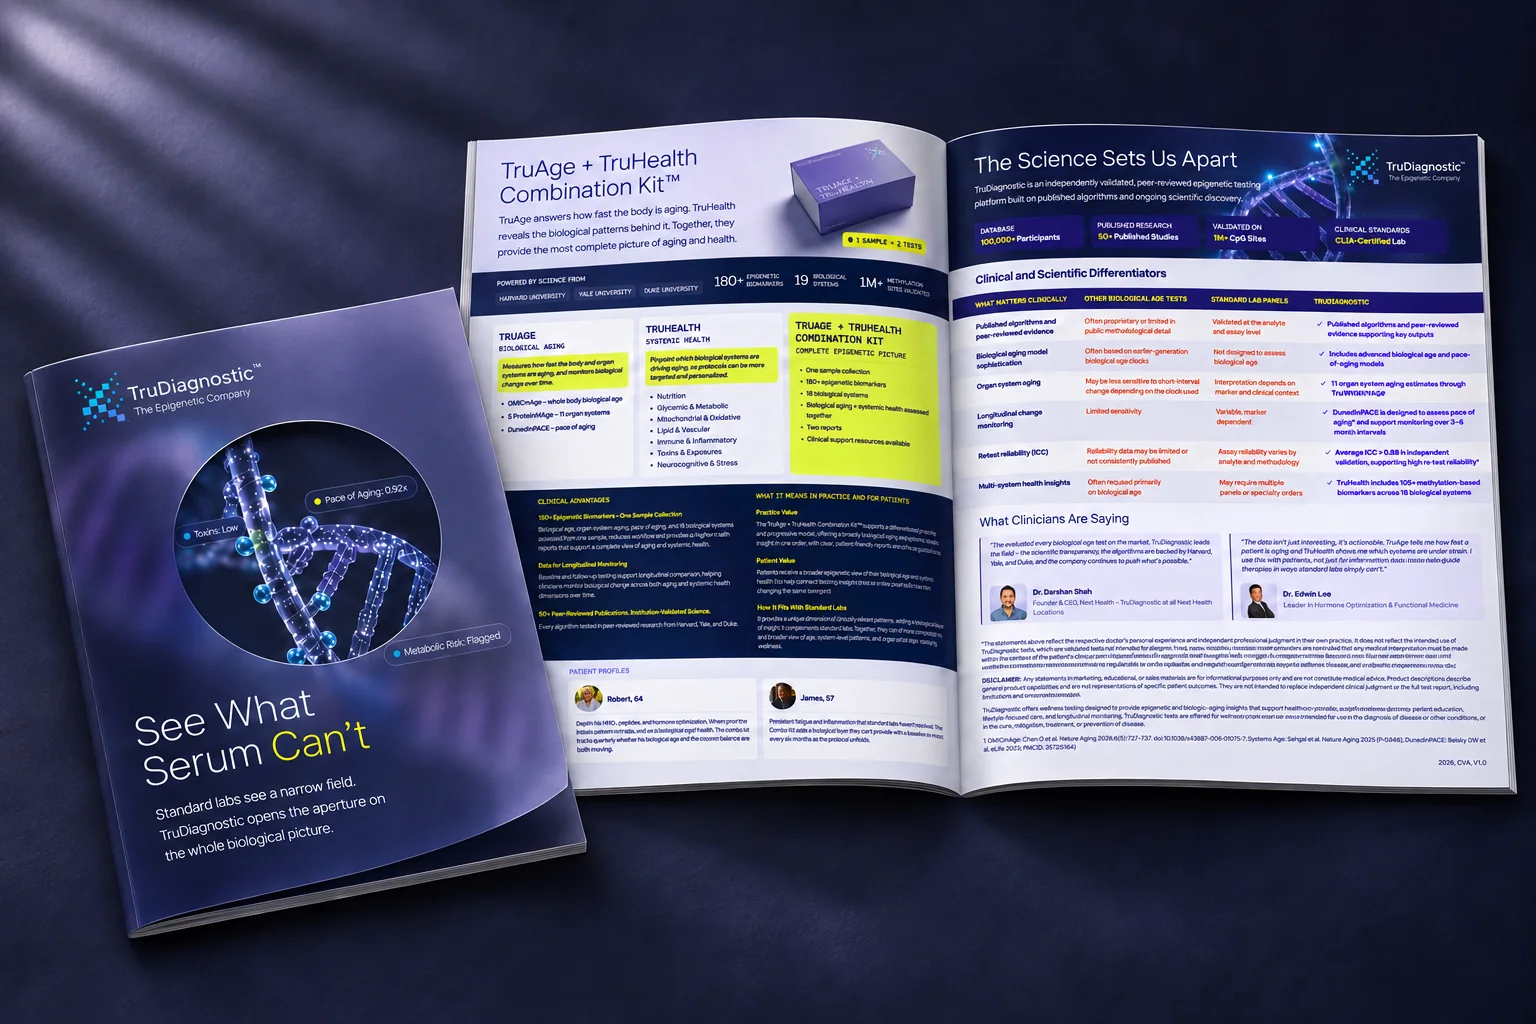
Clinical visual aid — open spread: combination kit and clinical differentiators

Dense clinical content, edited into a scannable hierarchy for a five-minute provider conversation.

Inside spread — product overview & differentiators
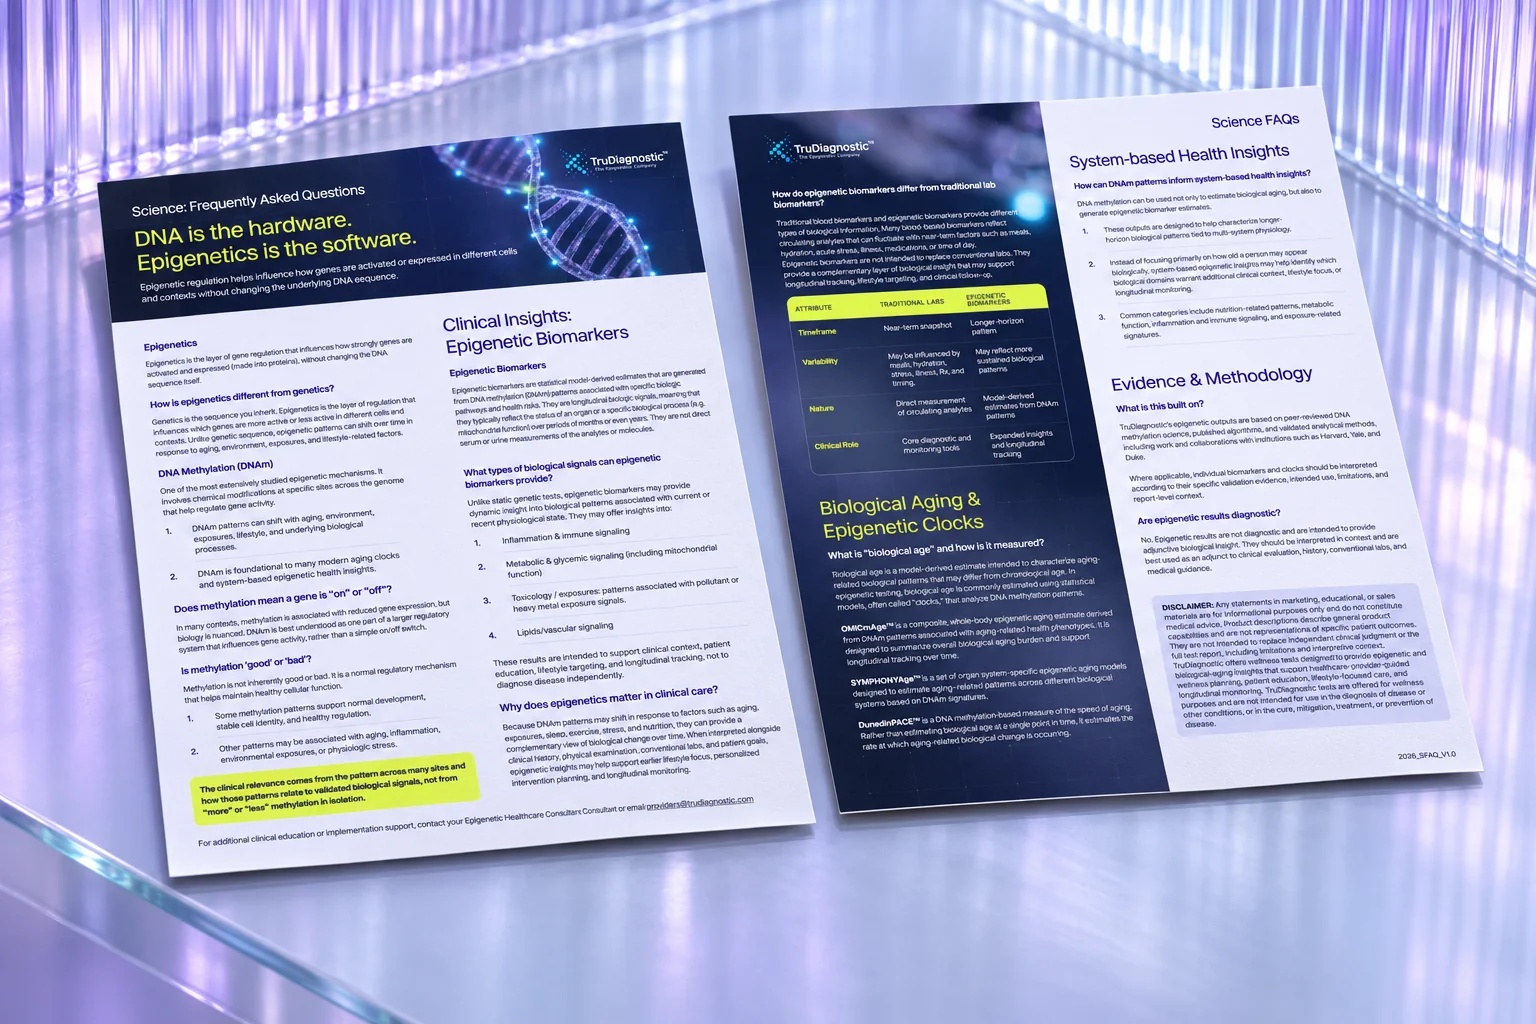
Science FAQ — front and reverse

Science FAQ — double-sided leave-behindEpigenetics, biomarkers & methodology

Patient-facing

The same system, softened for patients in the waiting room — what the test reveals, who it's for, and the science behind it.

Patient brochure — tri-fold, outside and inside

Patient brochure — tri-fold

04

From data to report

One of the core design challenges was translating dense biological information into something people could understand, discuss, and act on.

Report communication focused on hierarchy, context, and clarity — helping complex measurements feel less abstract.
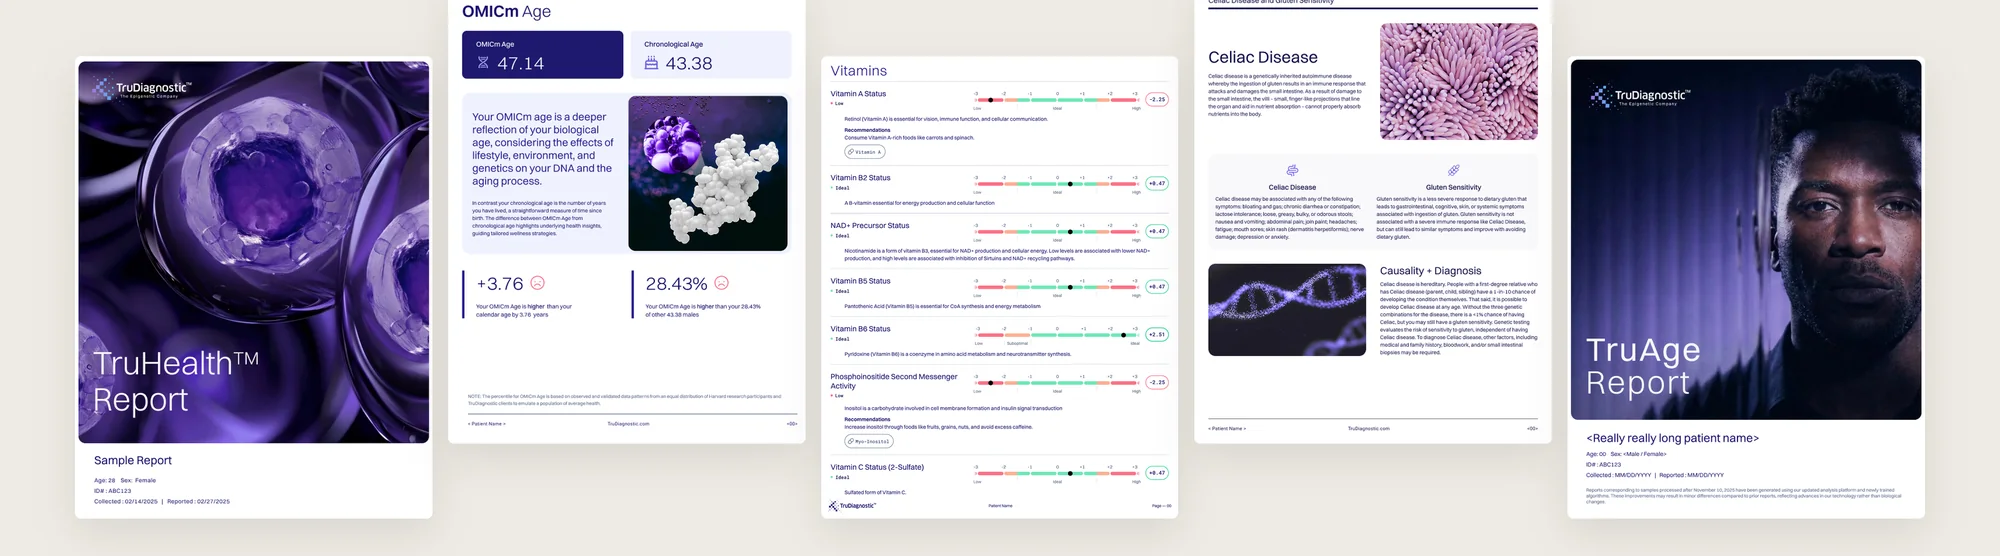
TruHealth and TruAge reports — cover, OMICm Age, vitamins, celiac and TruAge pages

TruAge & TruHealth reports — page systemSample data
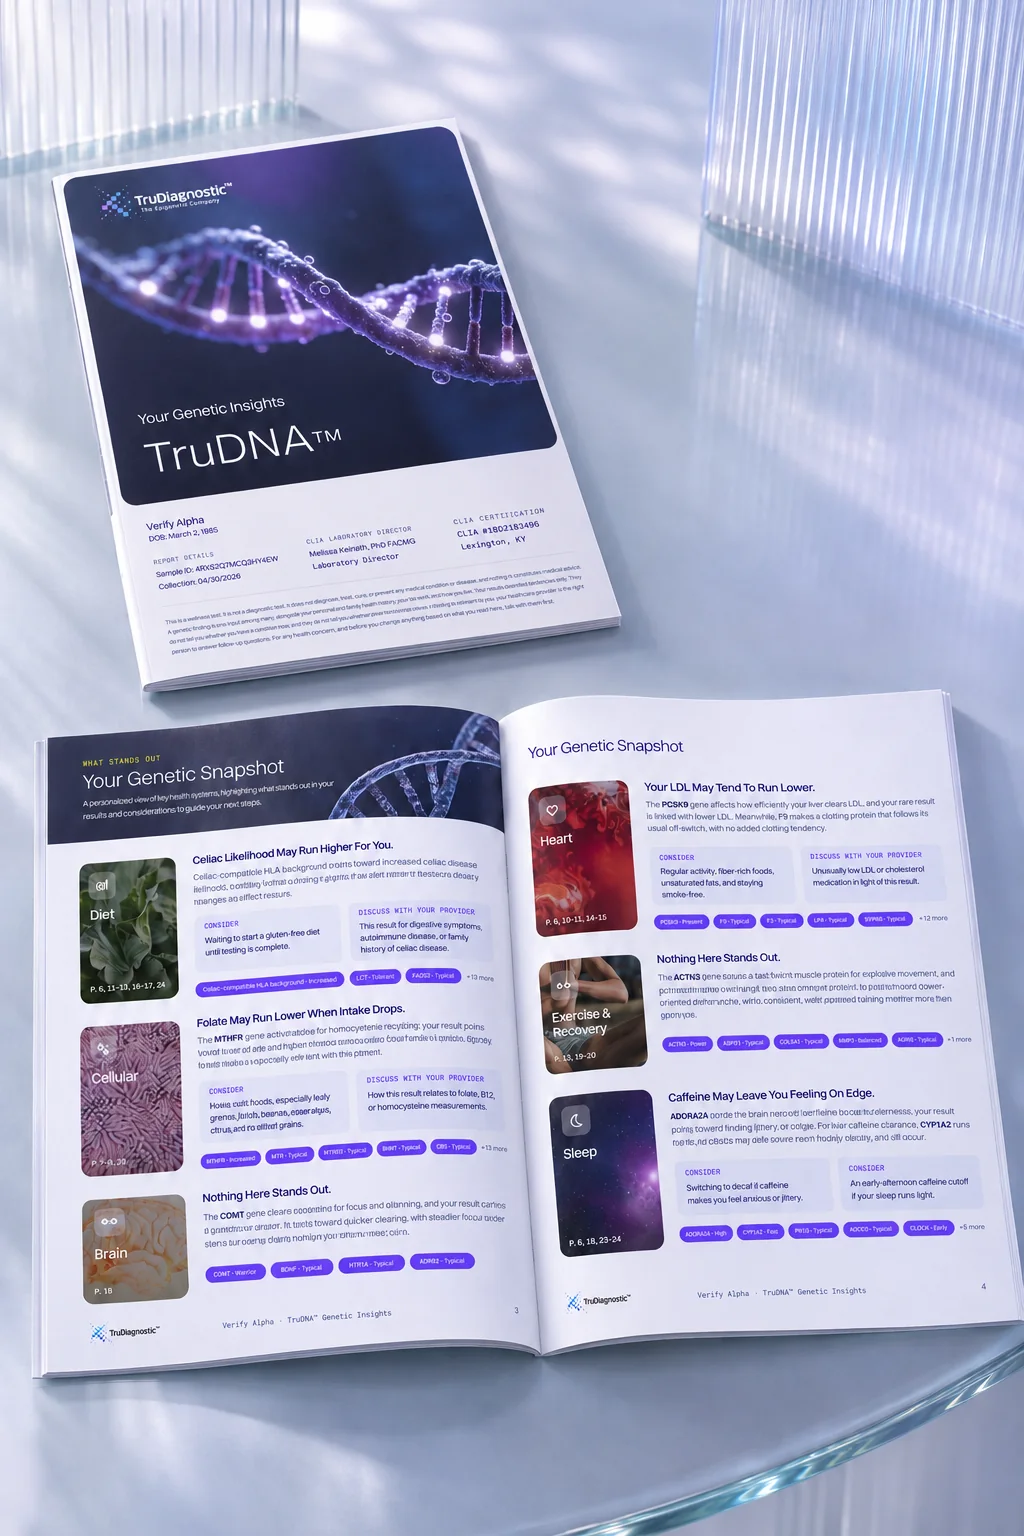
TruDNA genetic insights report — cover and snapshot spread

TruDNA report — cover & snapshot

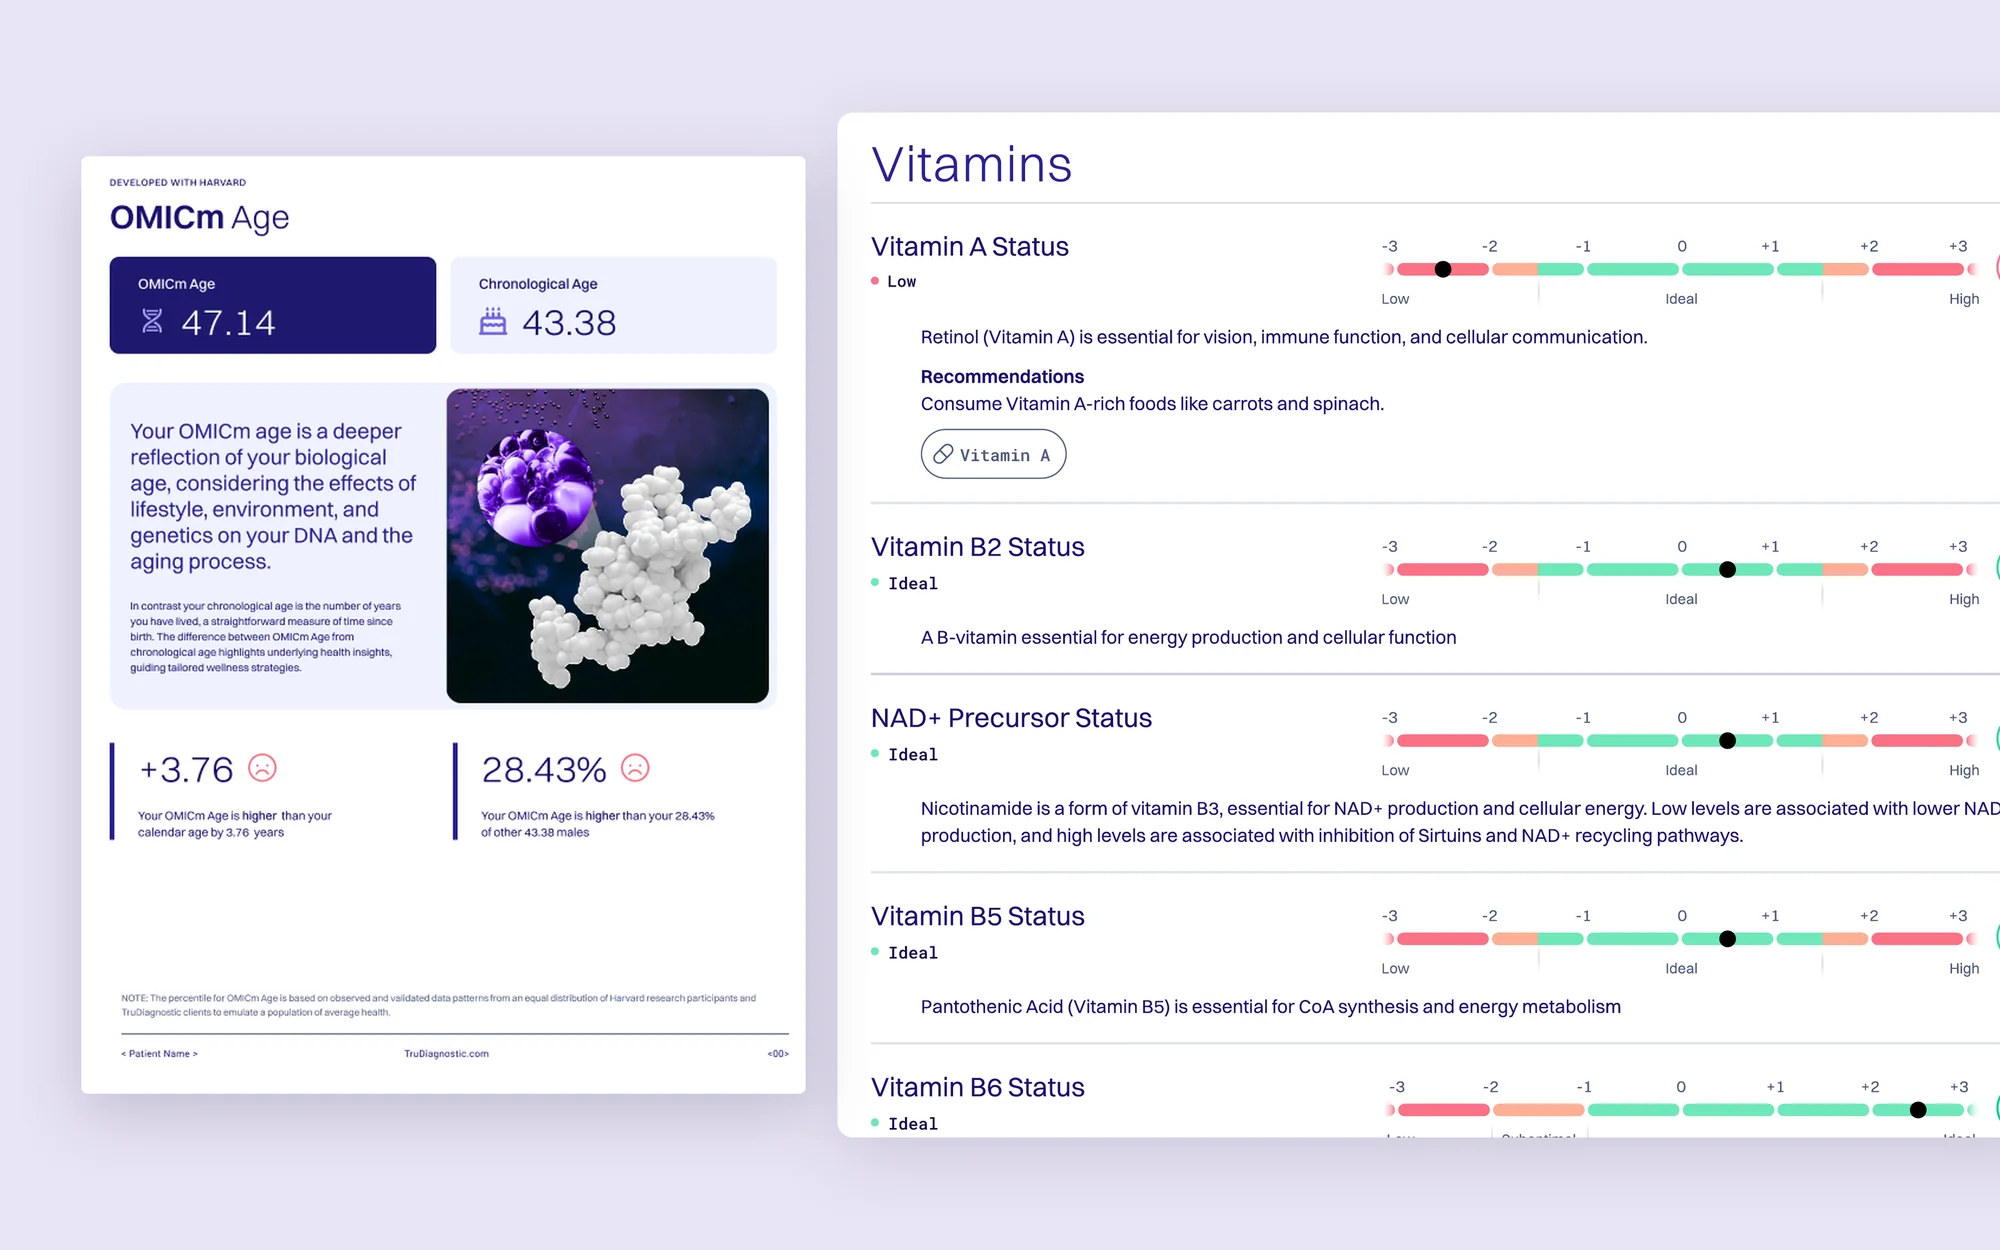
Report detail — OMICm Age and vitamin status pages

Detail — biological age & biomarker status
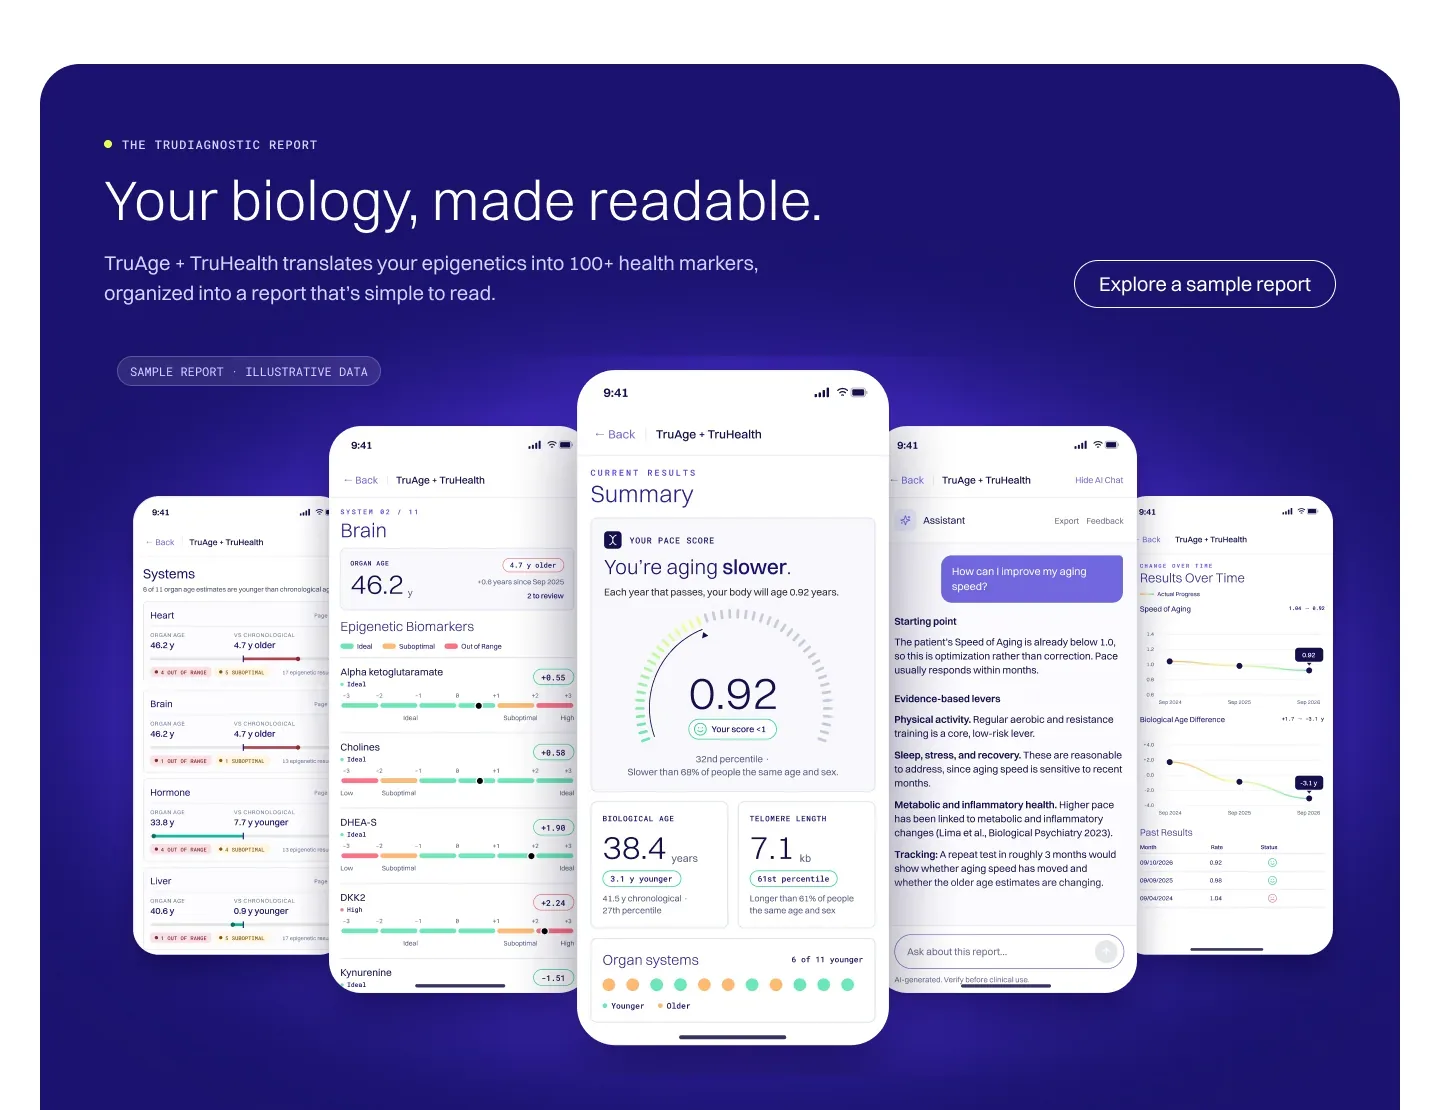
“Your biology, made readable” — report screens on the website

Digital report preview

05 — Campaigns

One idea, every

placement.

Valentine's — “Rose fade. Signal don't.”

Feed 4:5

Rose fade — cells
Rose fade — red
Valentine's — Flowers fade, insights don't
A better kind of gift — variation

Black Friday 2026 — one offer, several worlds

Feed 1:1

Black Friday — Your age is only the beginning
Black Friday — A better gift for your future self
Black Friday — Your age is only the beginning, lab scene
Black Friday — Your biology, made readable, report screens

DNA Day & always-on — the product in hand

Feed 4:5

DNA Day — You're not one age
DNA Day — It's all in your DNA. Just not how you think.
Product — kit at home
Product — kitchen with biomarker overlay

Family — “I want more years with you.”

Stories

I want more years with you — father and daughter
I want more years with you — friends
I want more years with you — couple

Story-first creative built around real moments rather than lab imagery.

06

Email & lifecycle

Lifecycle design extended the brand into a modular system supporting education, conversion, onboarding, and retention across different audiences.

Enough structure for consistency, while letting each communication feel distinct.

DTC email — Welcome — Ready to see your biology?
DTC email — Education — It goes way beyond your age
DTC email — Comparison — Not all at-home tests are alike
DTC email — Social proof — Don't just take our word for it
DTC email — Objection handling — Quick answers before you start

07

Social

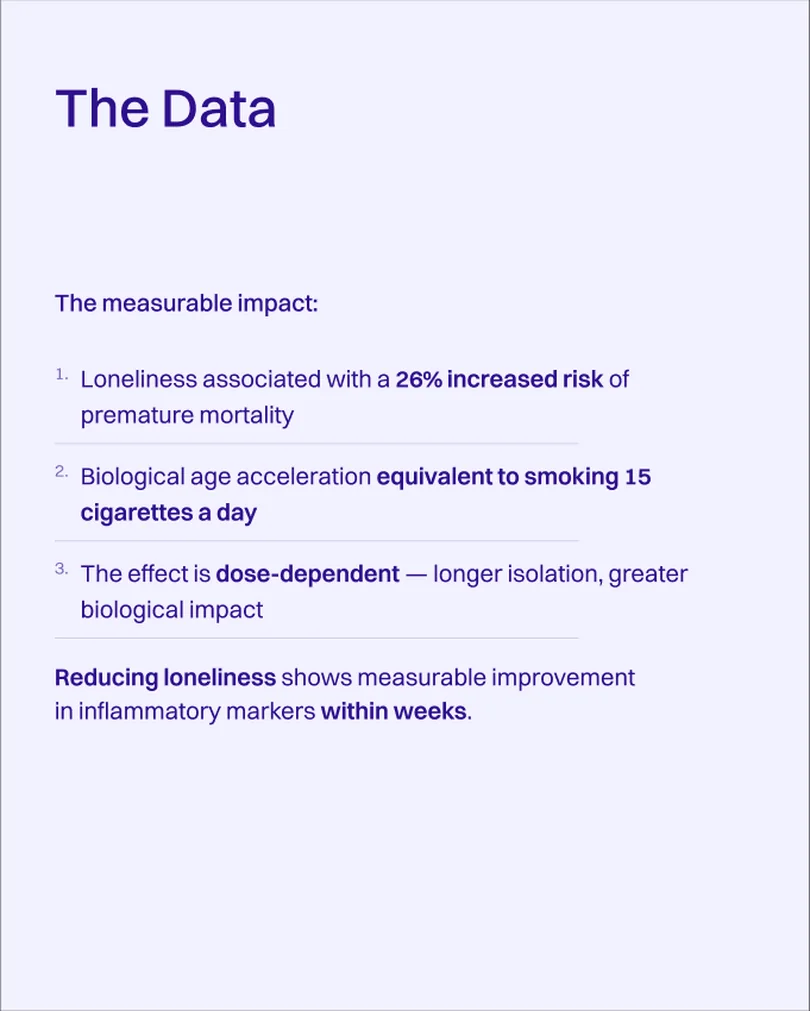
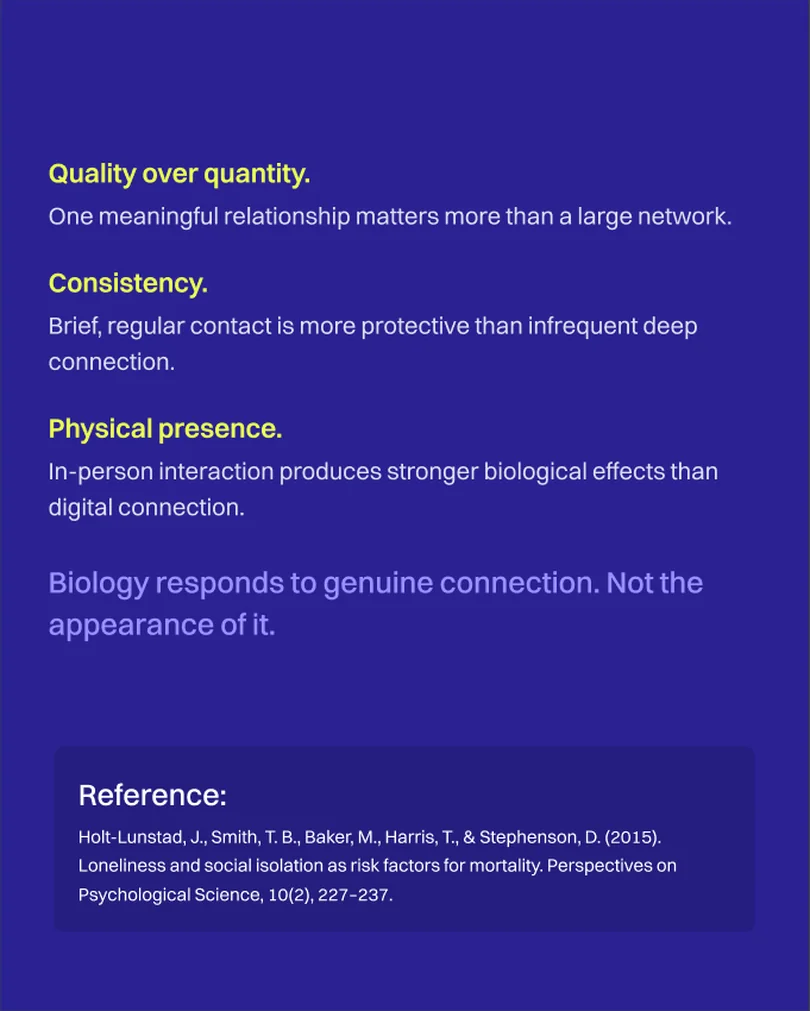
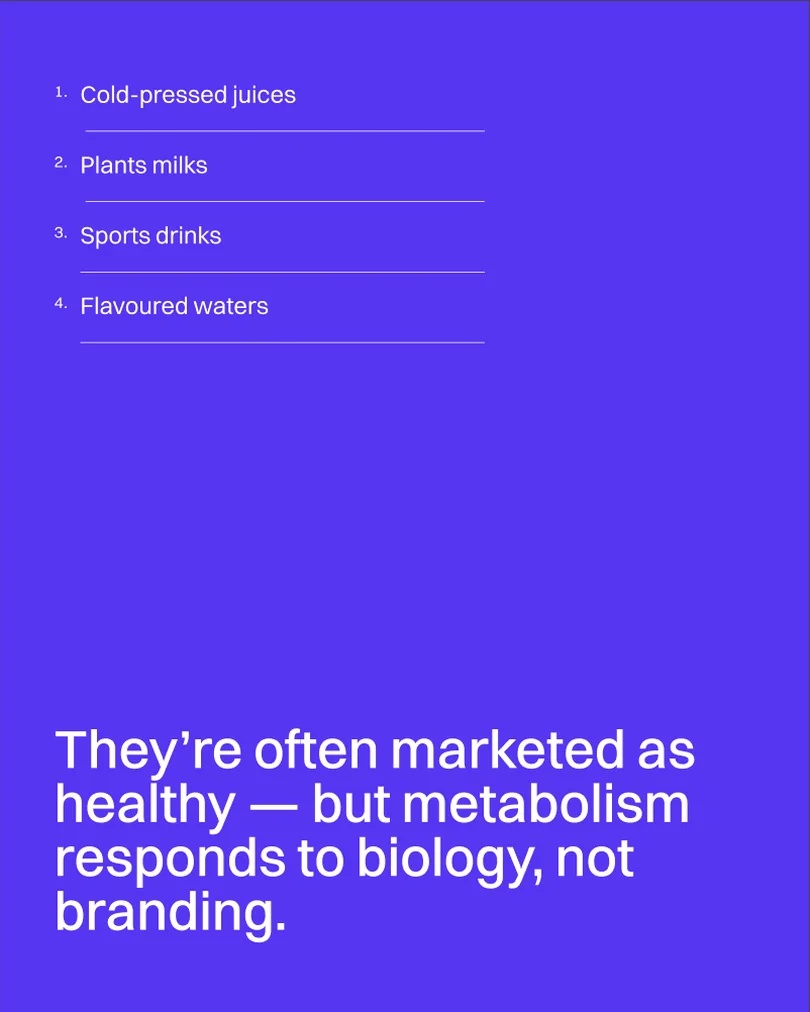
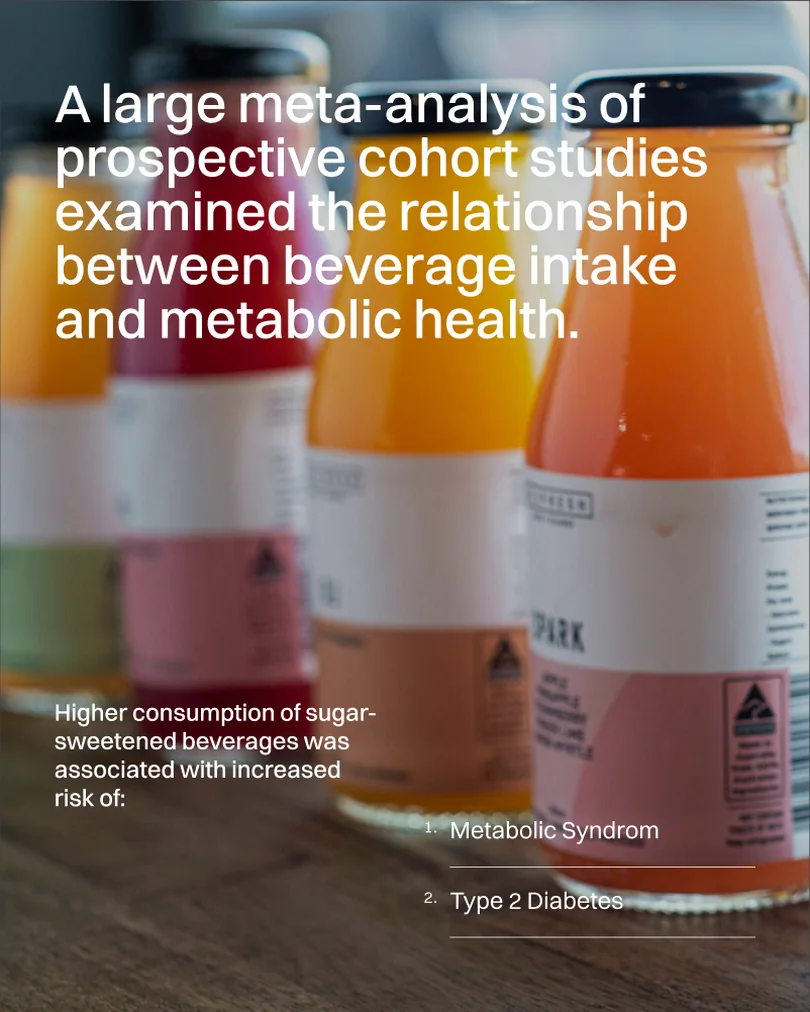
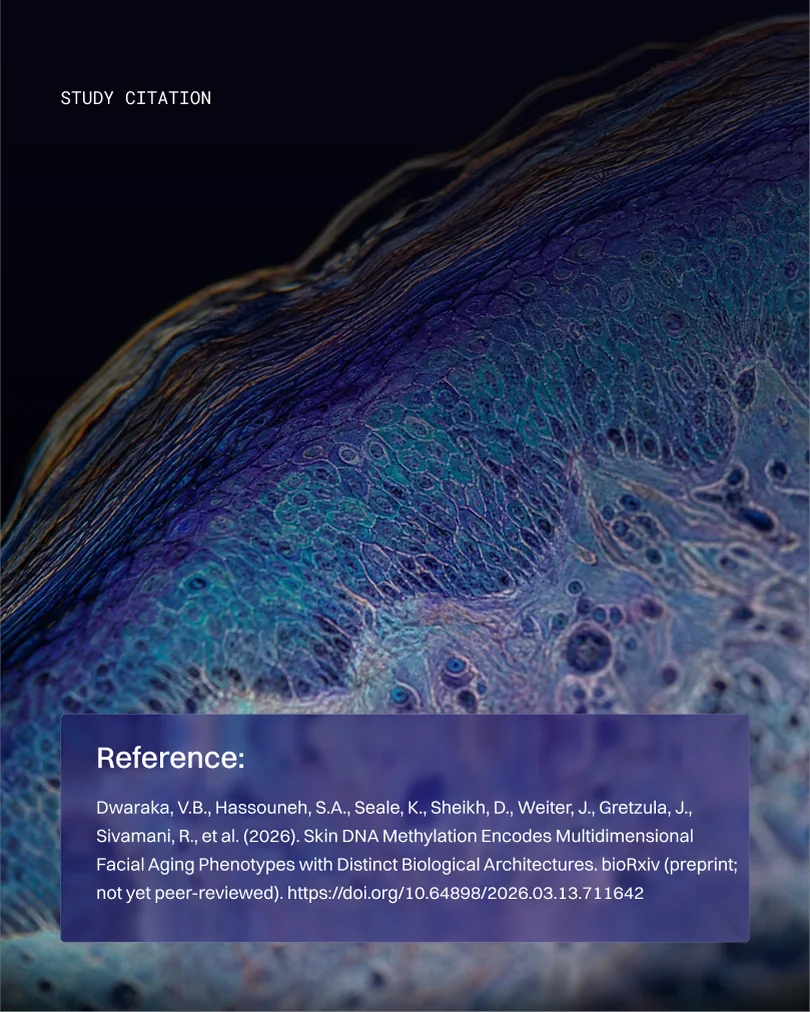
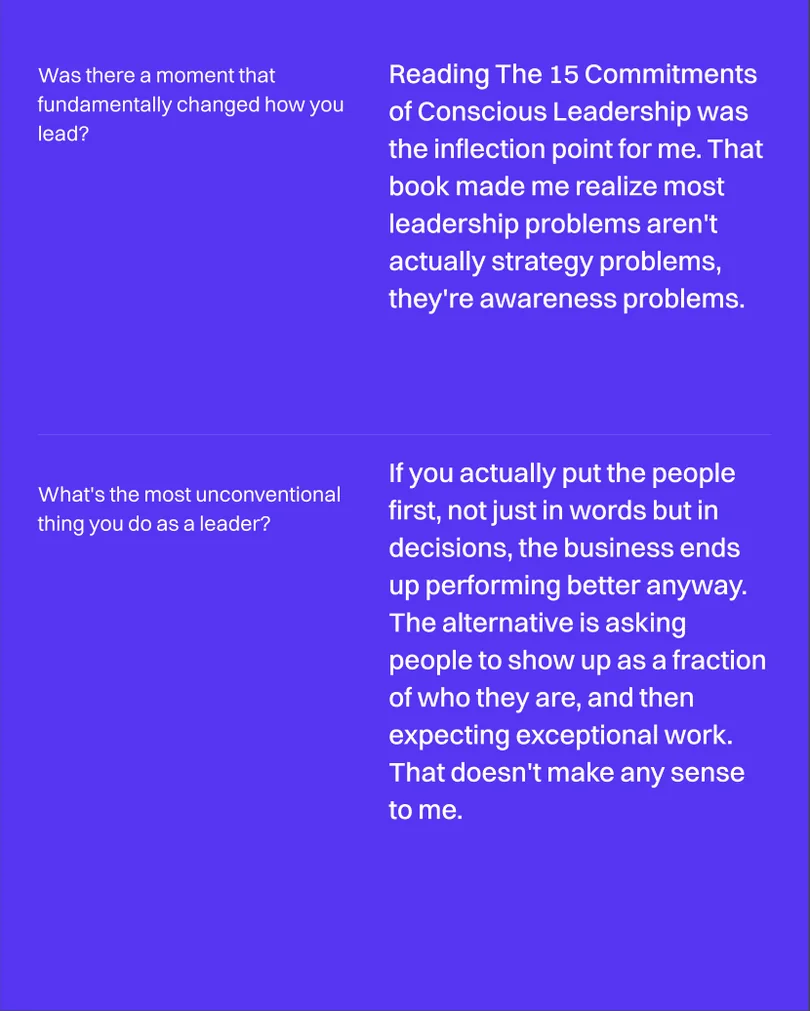
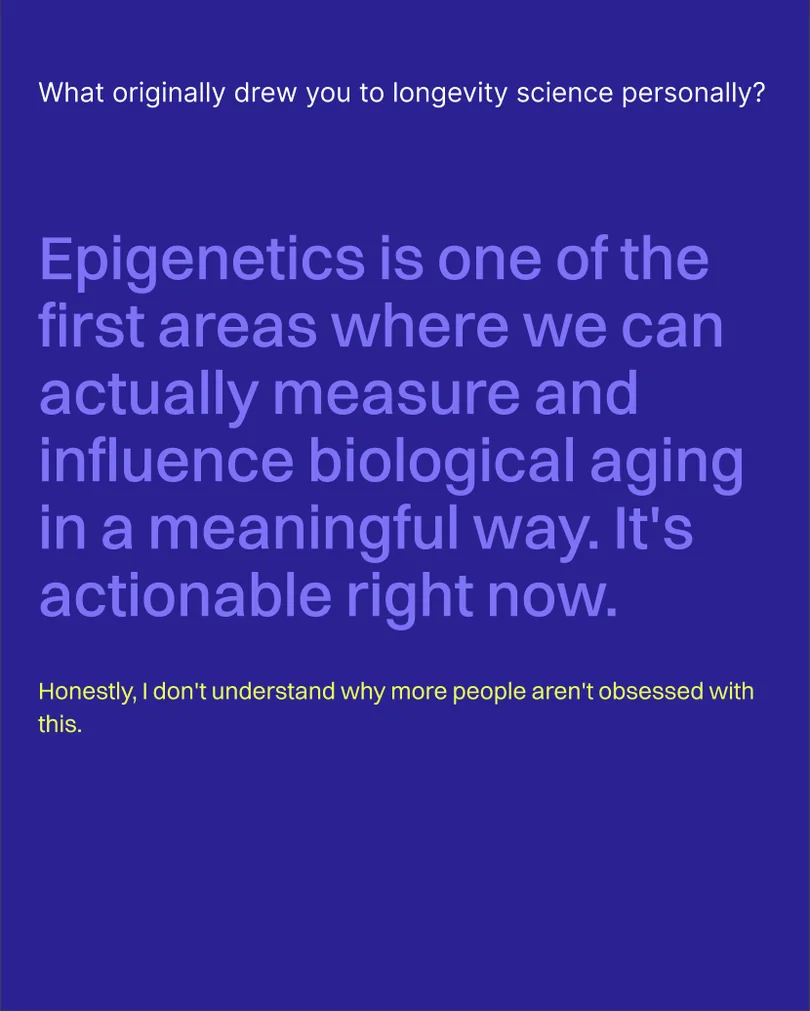
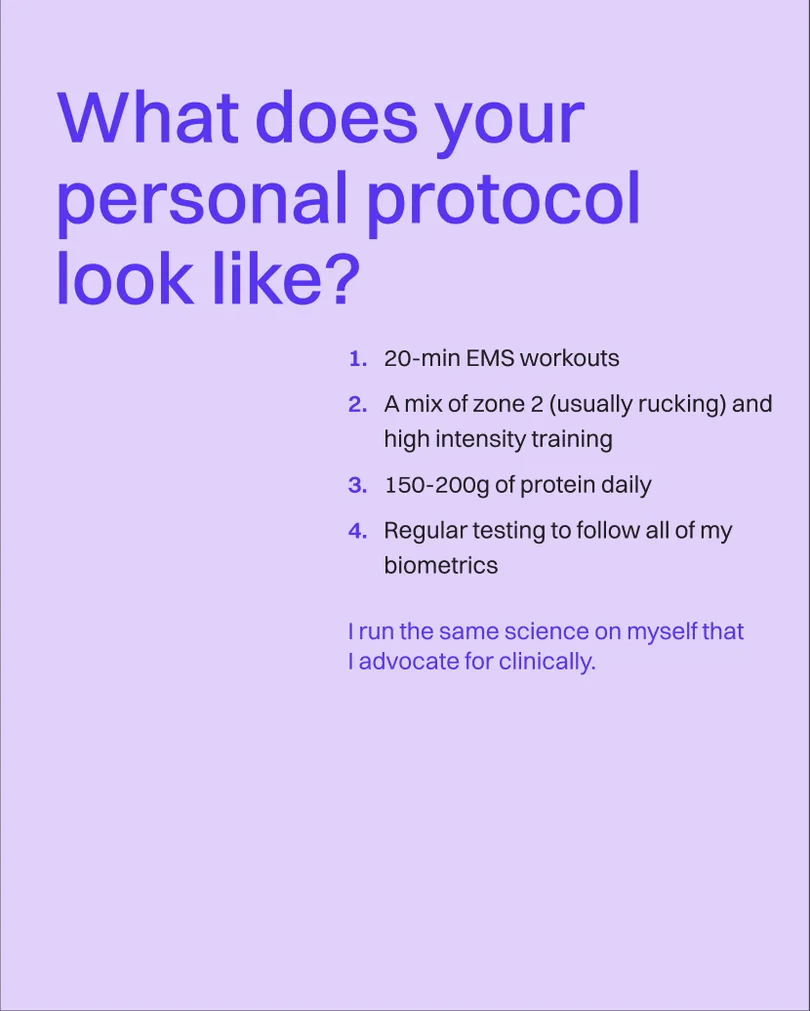
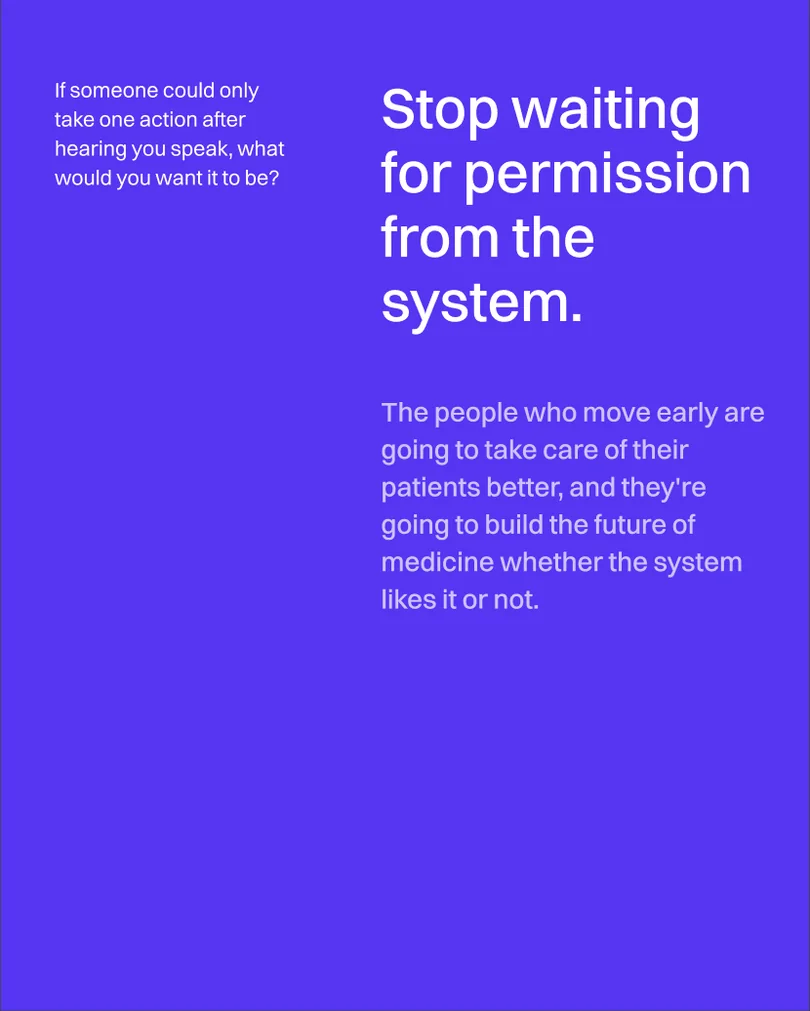
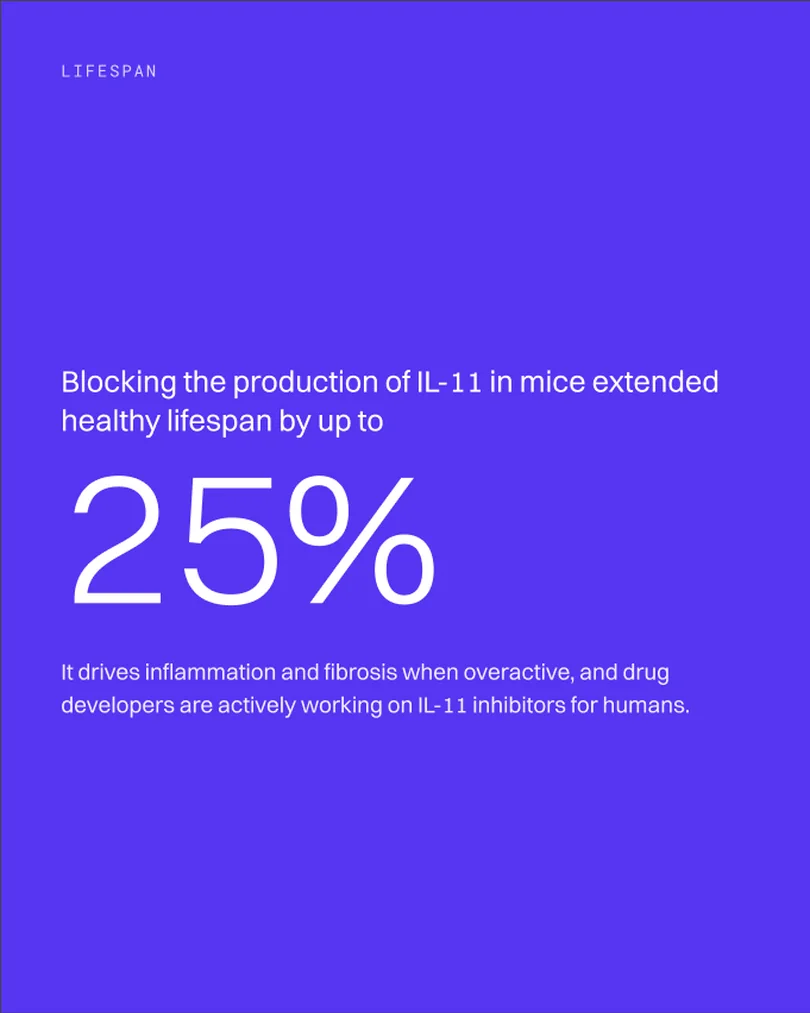
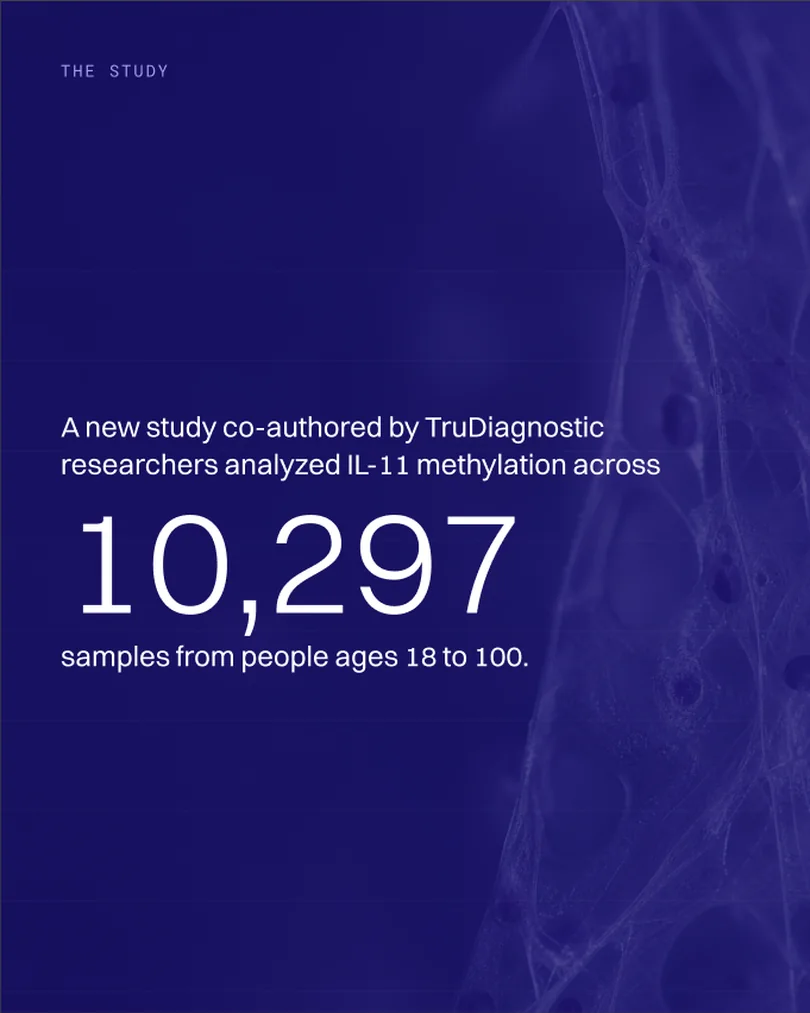
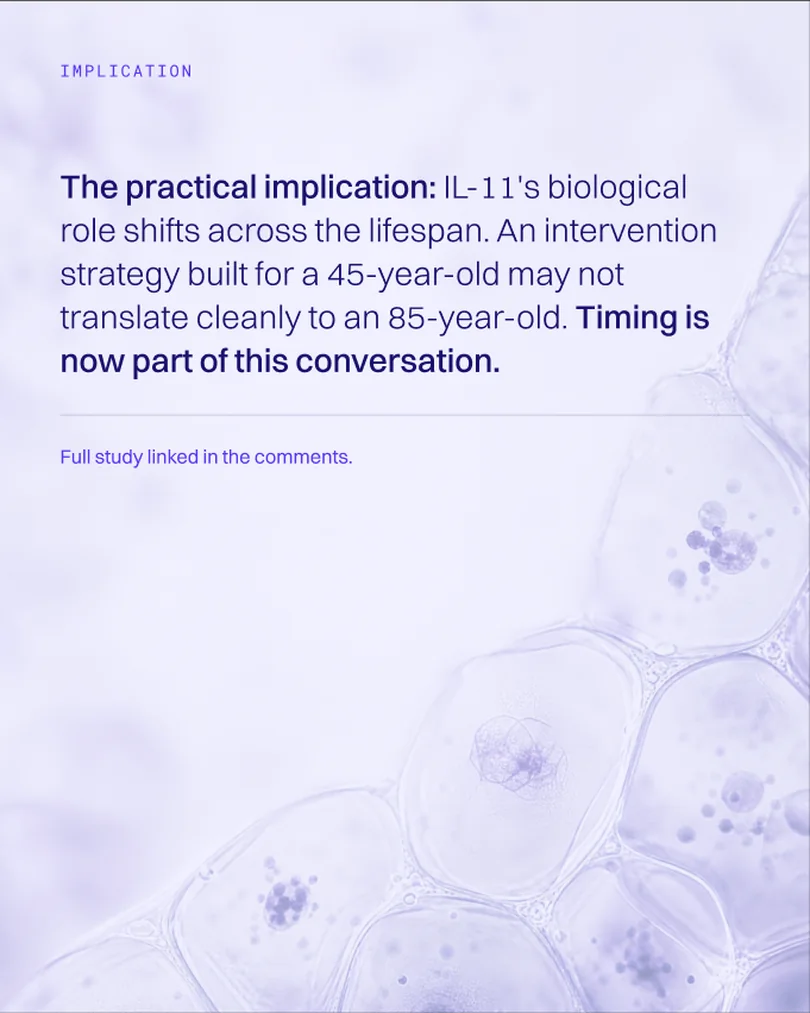
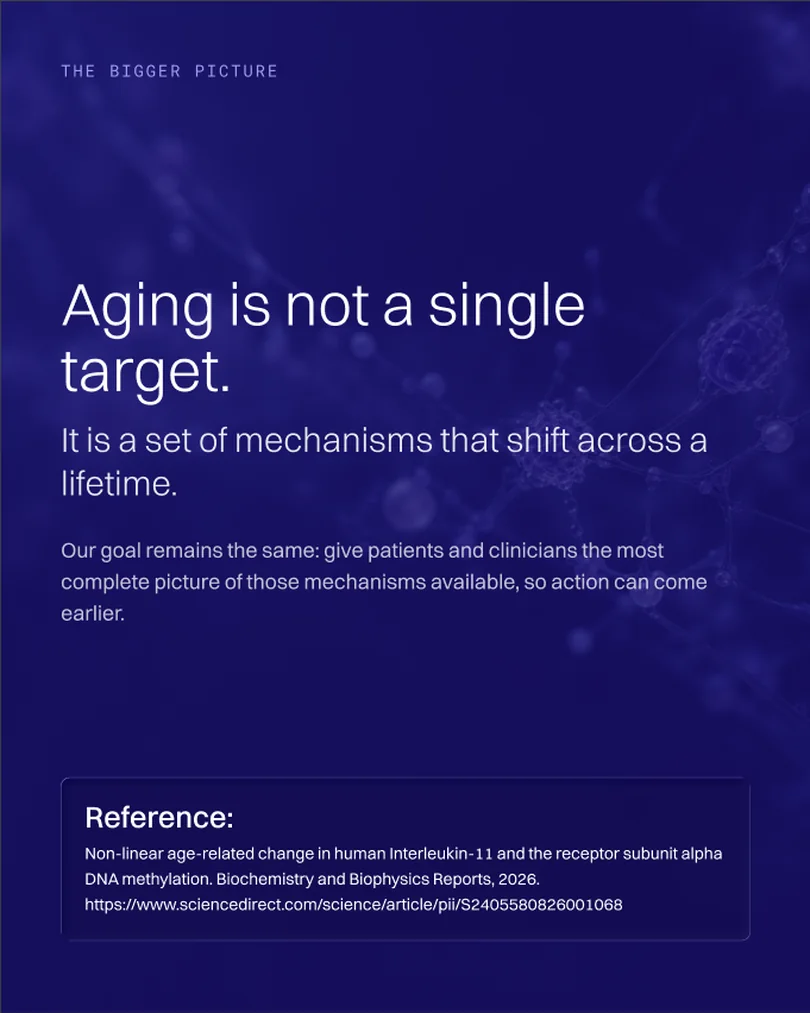
Educational carousels that turn peer-reviewed research into a clear story, slide by slide: a hook, the science, what it means, and the reference.
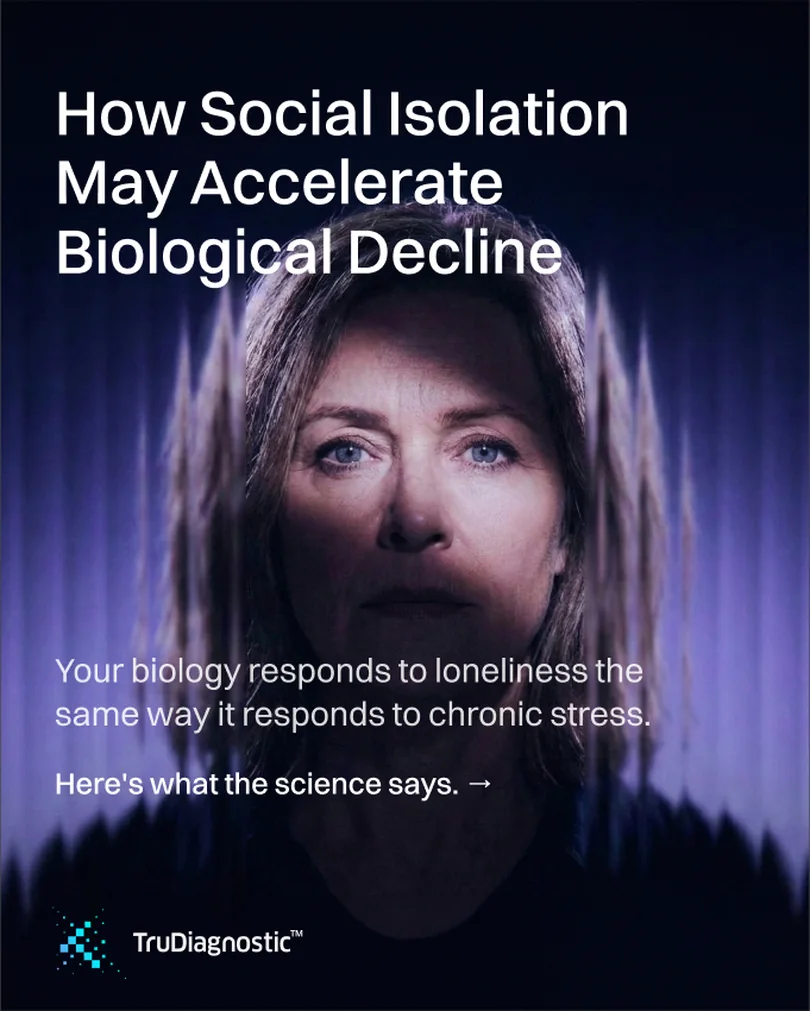
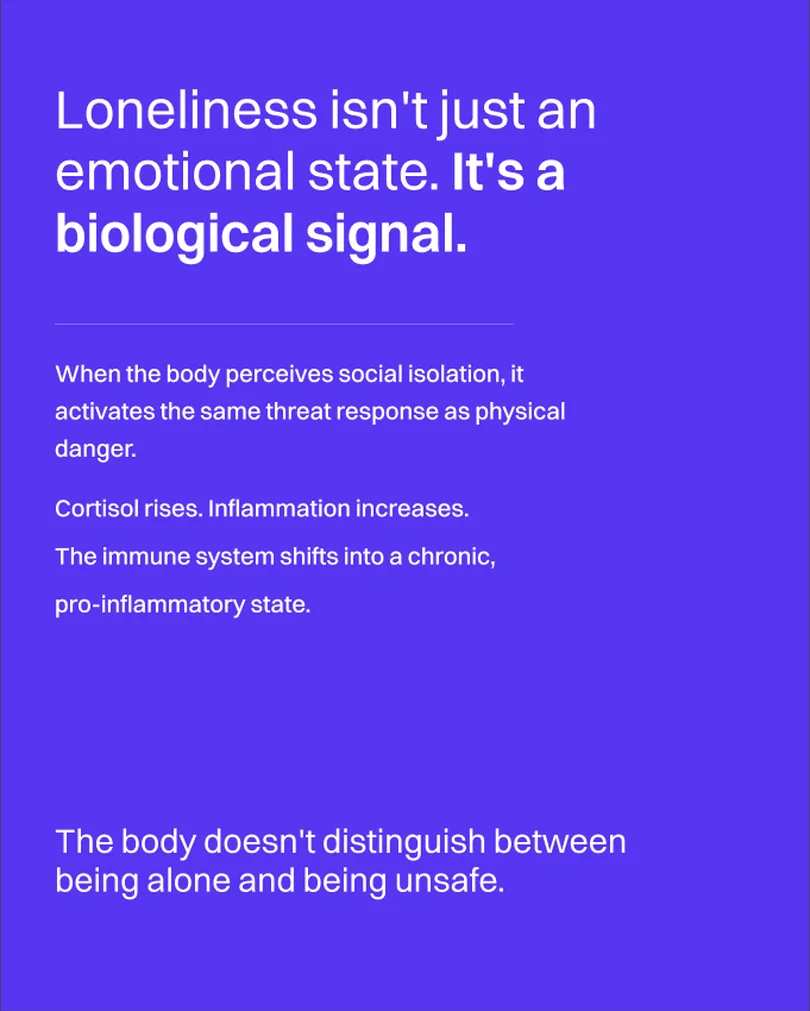
Carousel — How social isolation may accelerate biological decline, slide 1
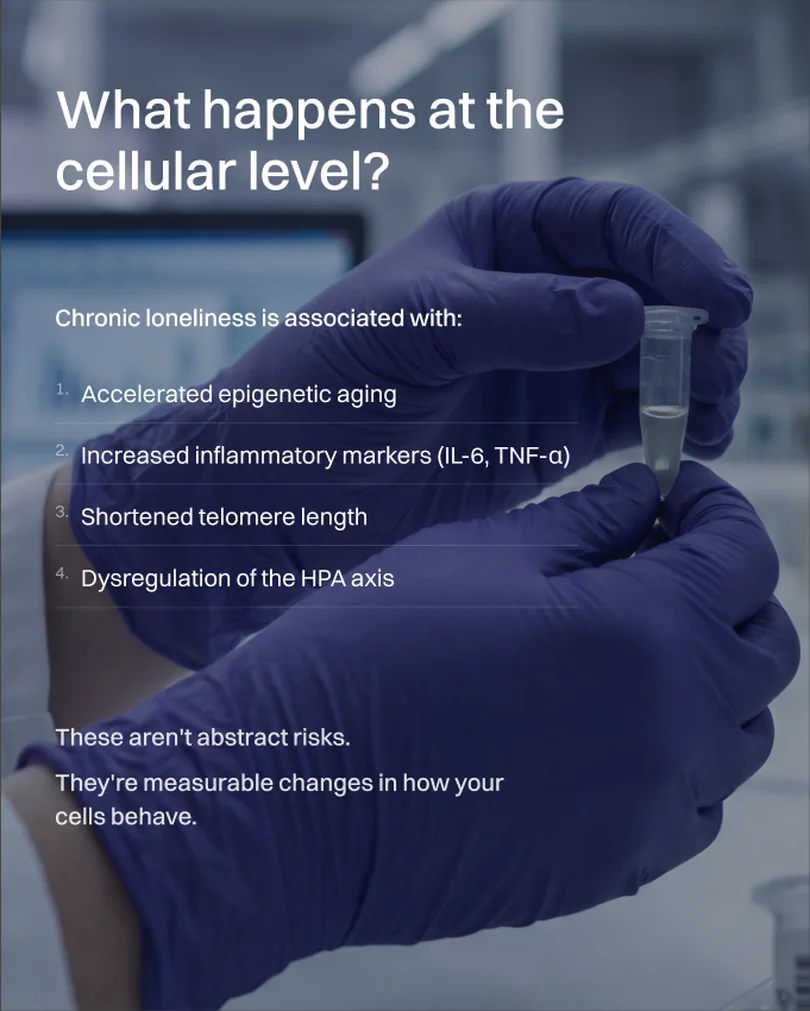
Carousel — How social isolation may accelerate biological decline, slide 2
Carousel — How social isolation may accelerate biological decline, slide 3
Carousel — How social isolation may accelerate biological decline, slide 4
Carousel — How social isolation may accelerate biological decline, slide 5
Carousel — How social isolation may accelerate biological decline, slide 6
Carousel — How social isolation may accelerate biological decline, slide 7
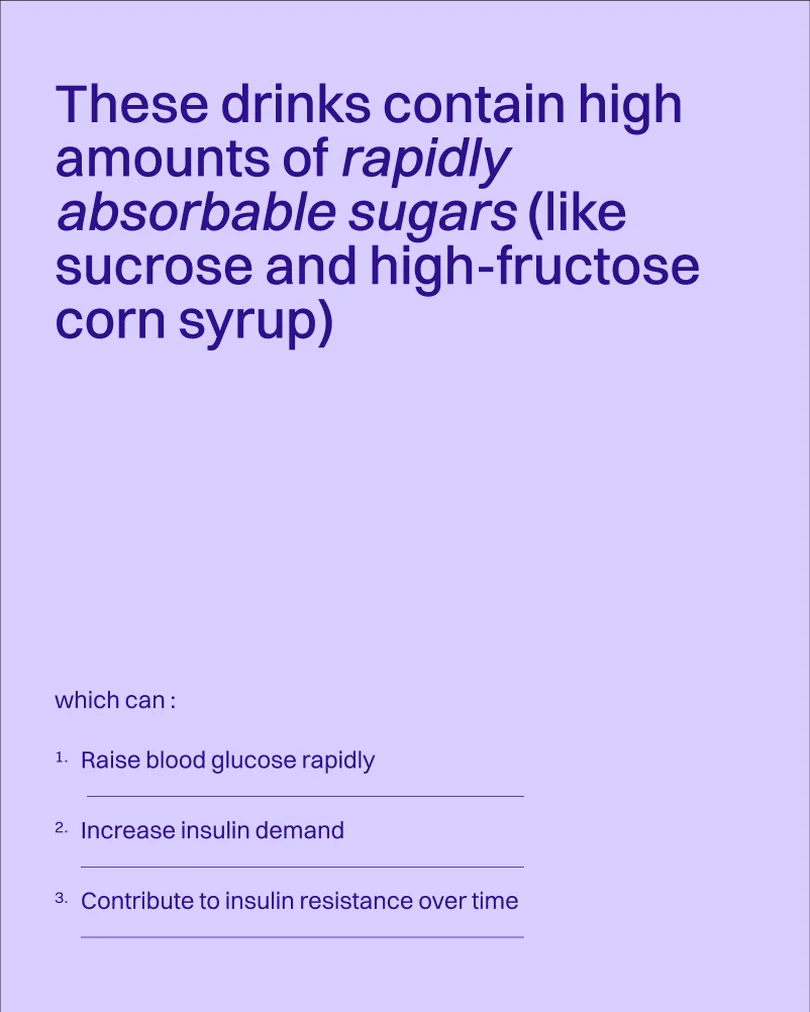
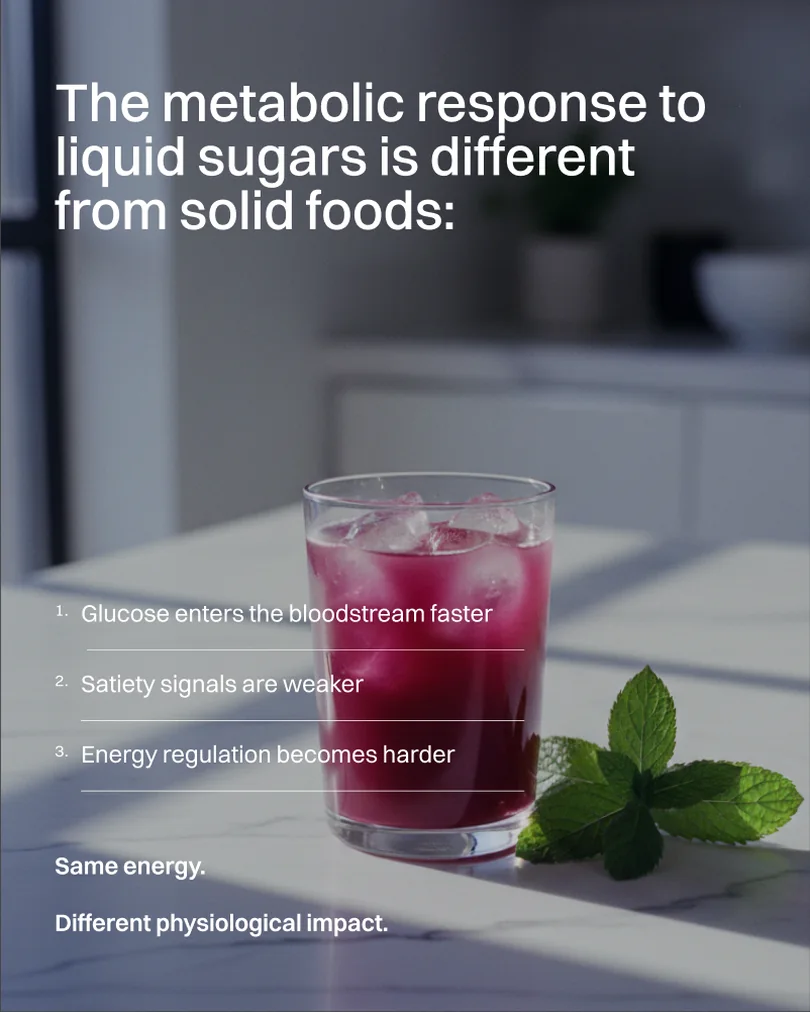
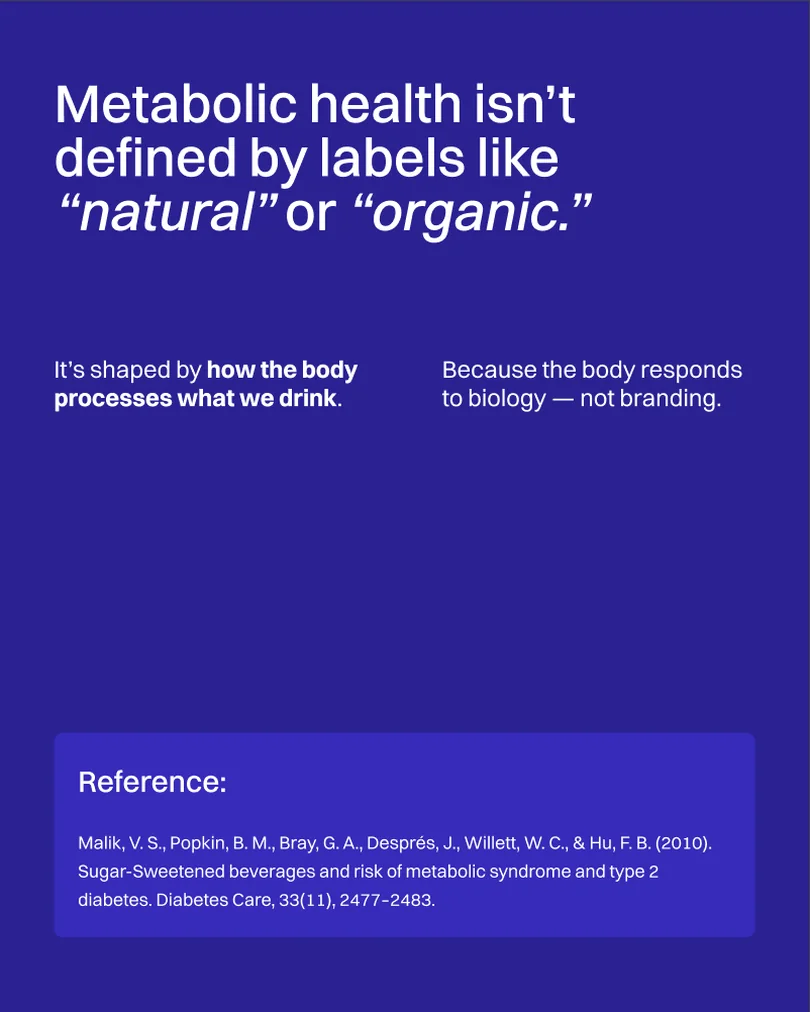
Carousel — Are “healthy” beverages driving metabolic risk?, slide 1
Carousel — Are “healthy” beverages driving metabolic risk?, slide 2
Carousel — Are “healthy” beverages driving metabolic risk?, slide 3
Carousel — Are “healthy” beverages driving metabolic risk?, slide 4
Carousel — Are “healthy” beverages driving metabolic risk?, slide 5
Carousel — Are “healthy” beverages driving metabolic risk?, slide 6
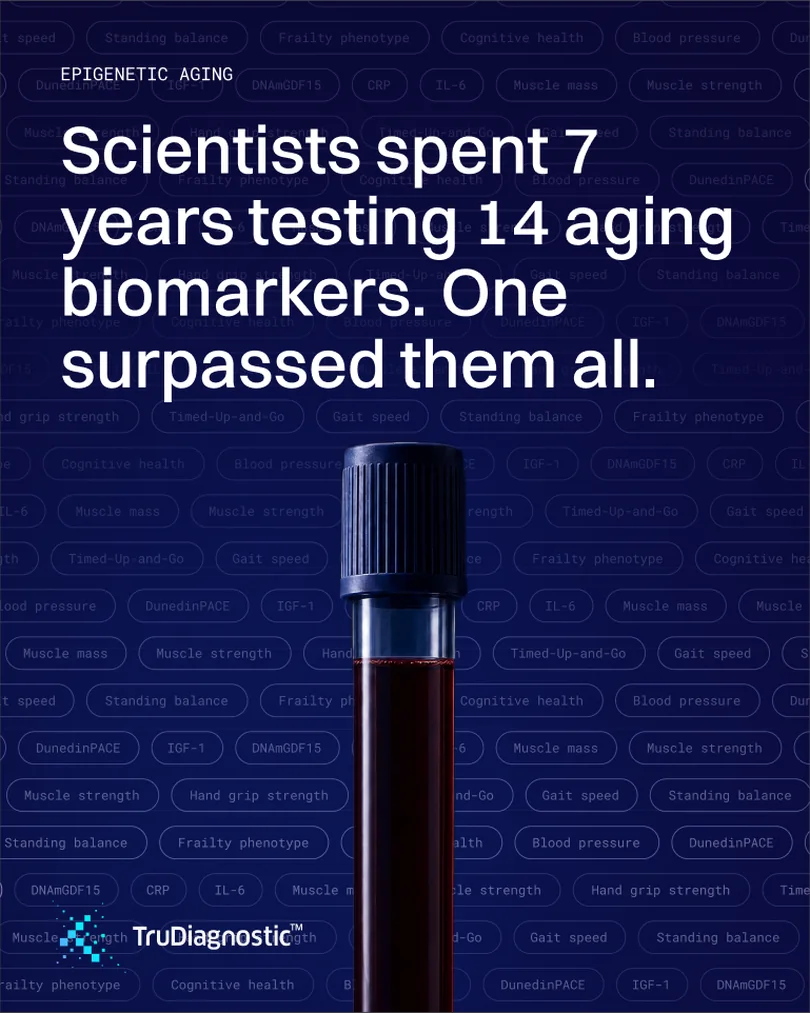
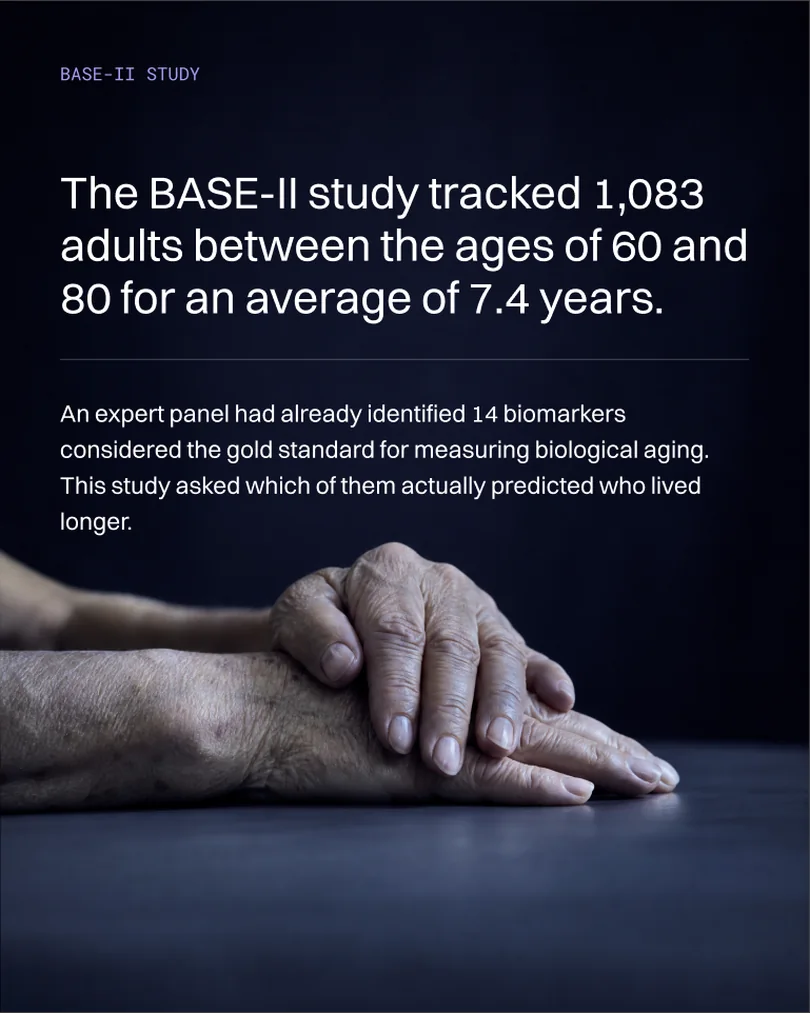
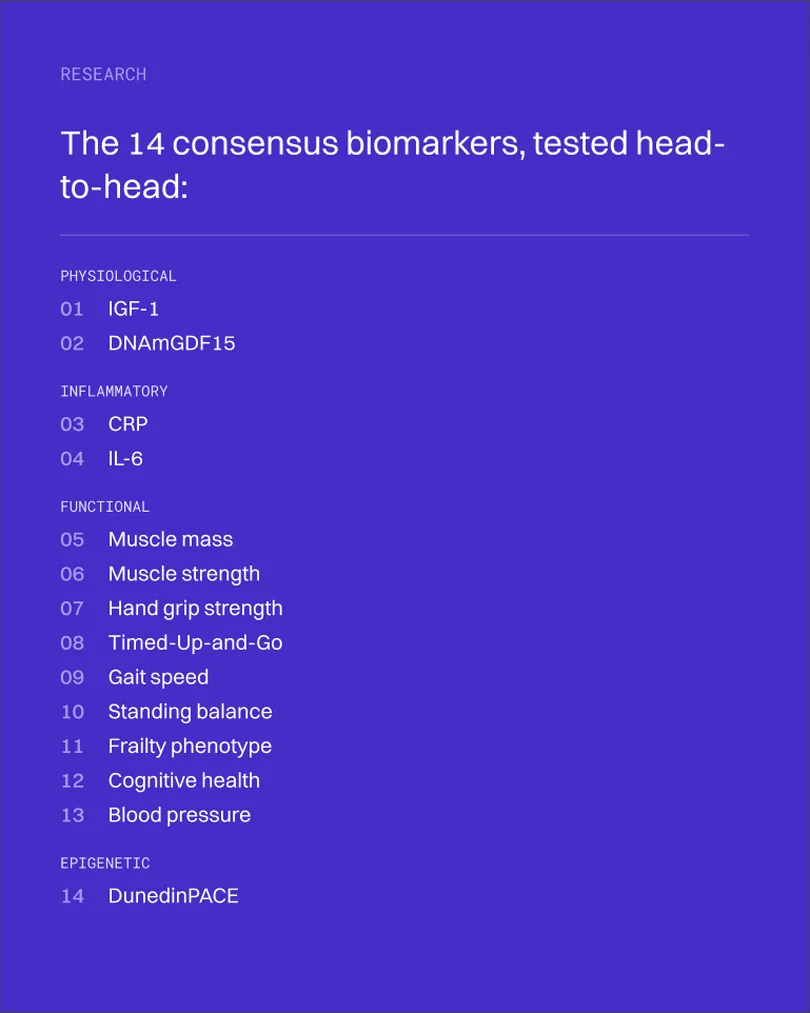
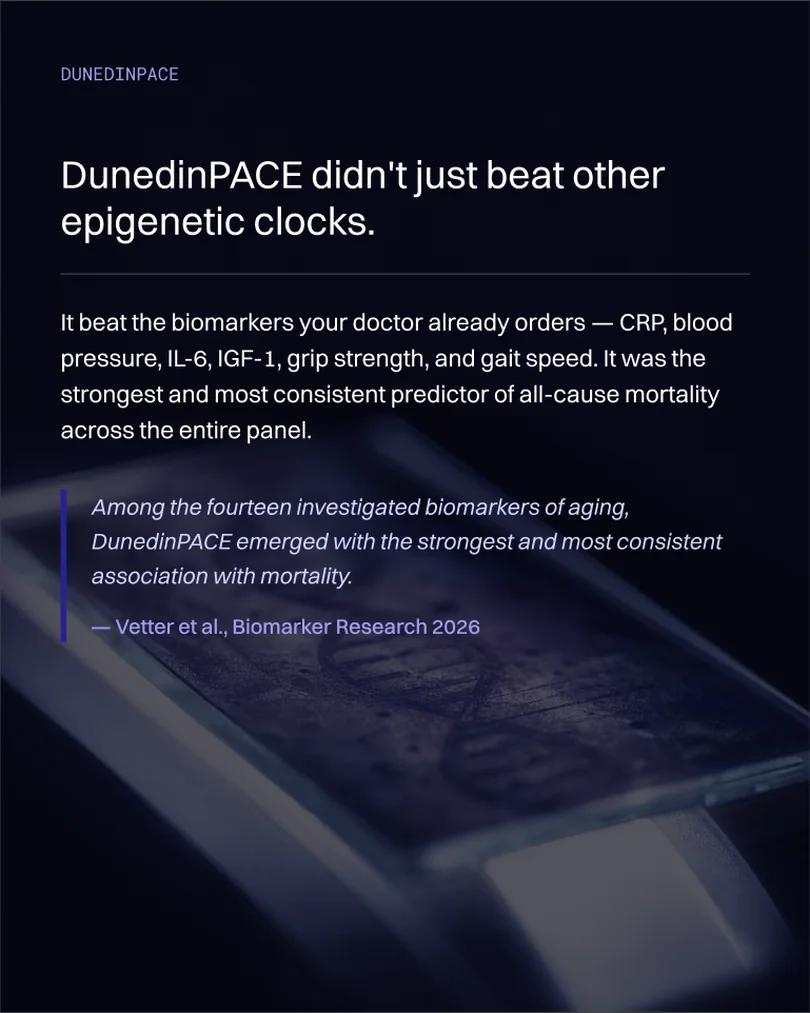
Carousel — Scientists tested 14 aging biomarkers, slide 1
Carousel — Scientists tested 14 aging biomarkers, slide 2
Carousel — Scientists tested 14 aging biomarkers, slide 3
Carousel — Scientists tested 14 aging biomarkers, slide 4
Carousel — Scientists tested 14 aging biomarkers, slide 5
Carousel — Scientists tested 14 aging biomarkers, slide 6
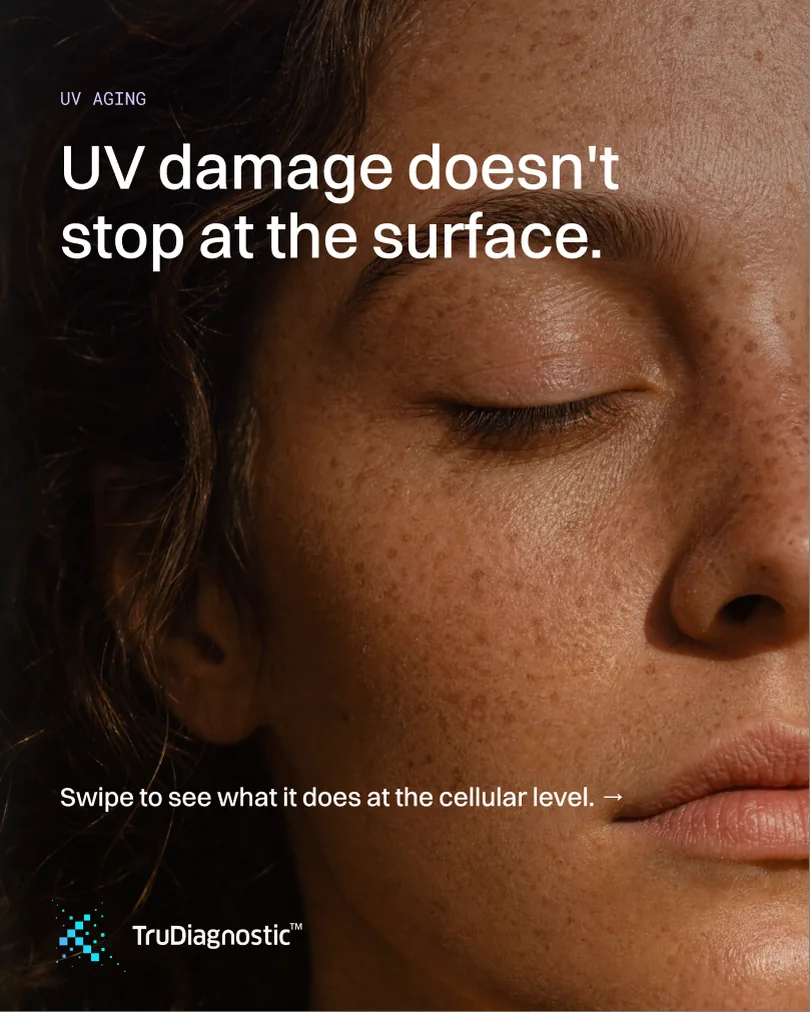
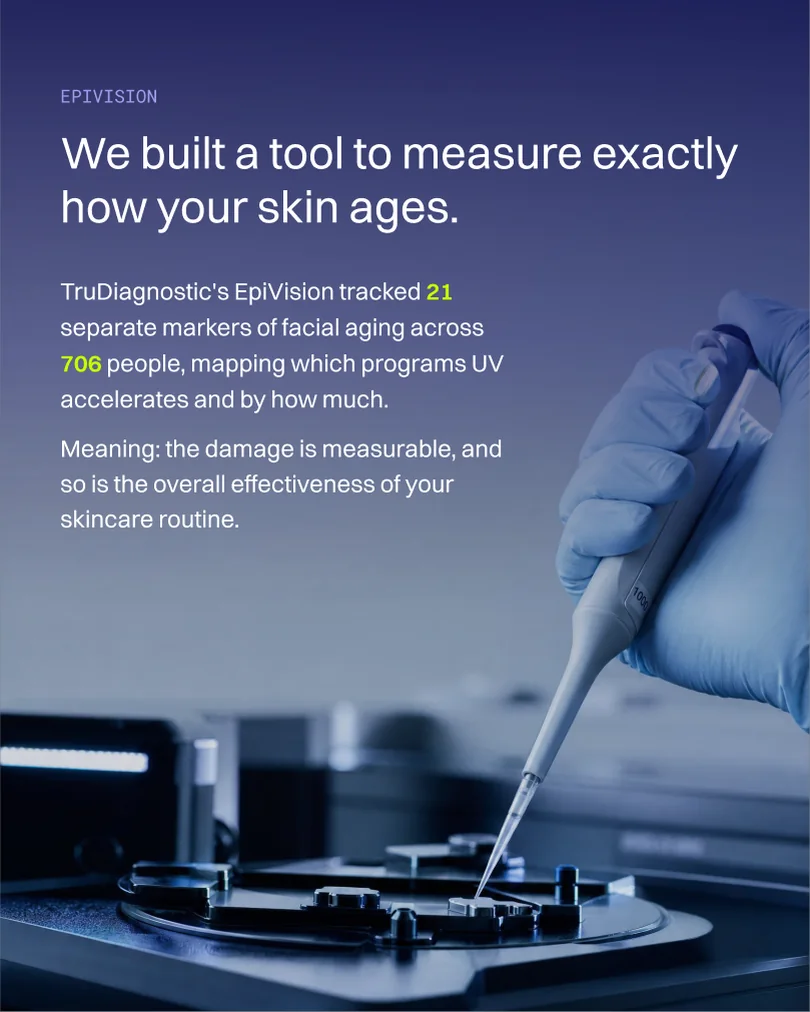
Carousel — UV damage doesn’t stop at the surface, slide 1
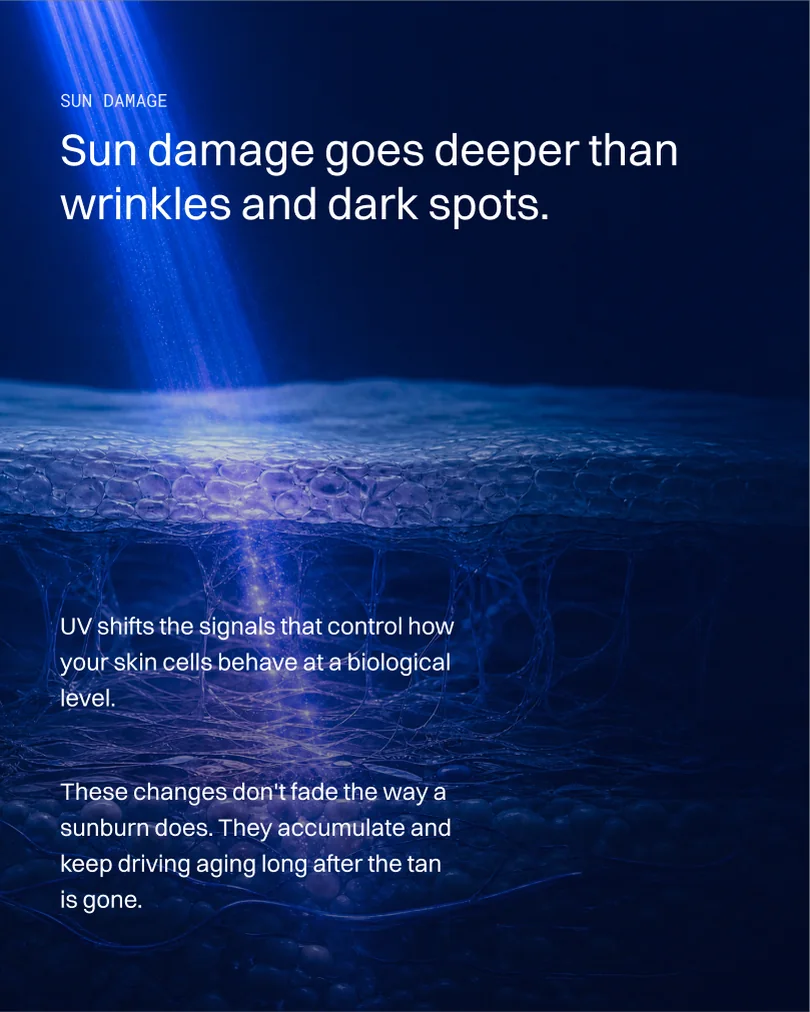
Carousel — UV damage doesn’t stop at the surface, slide 2
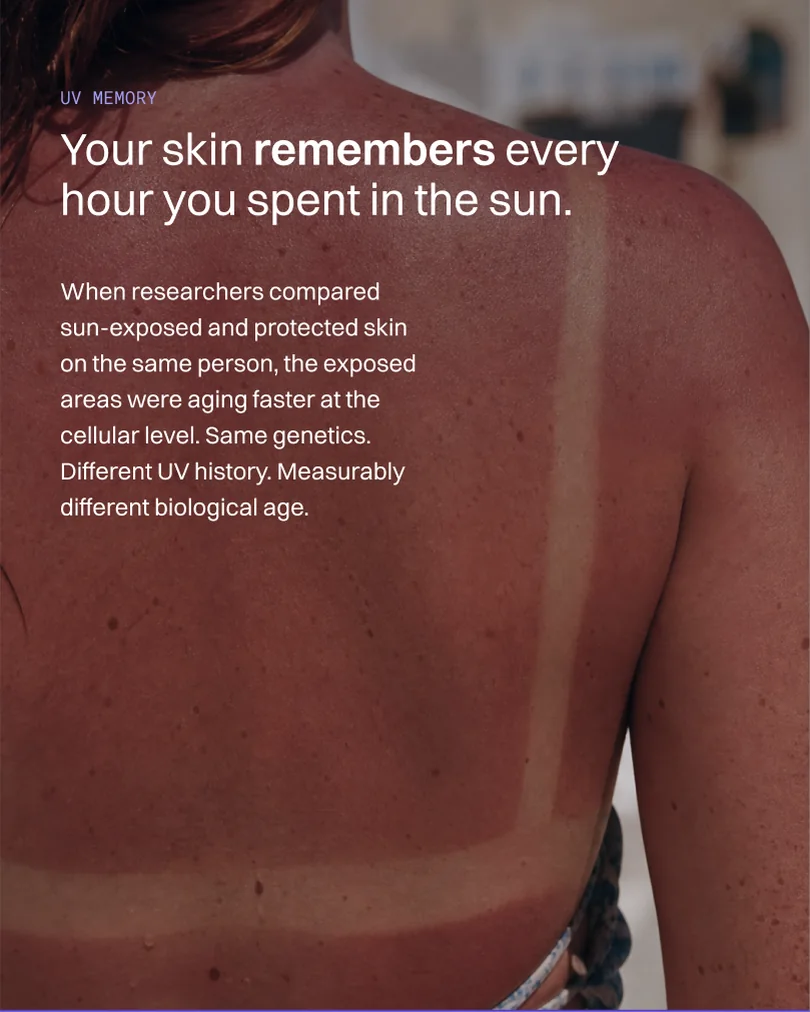
Carousel — UV damage doesn’t stop at the surface, slide 3
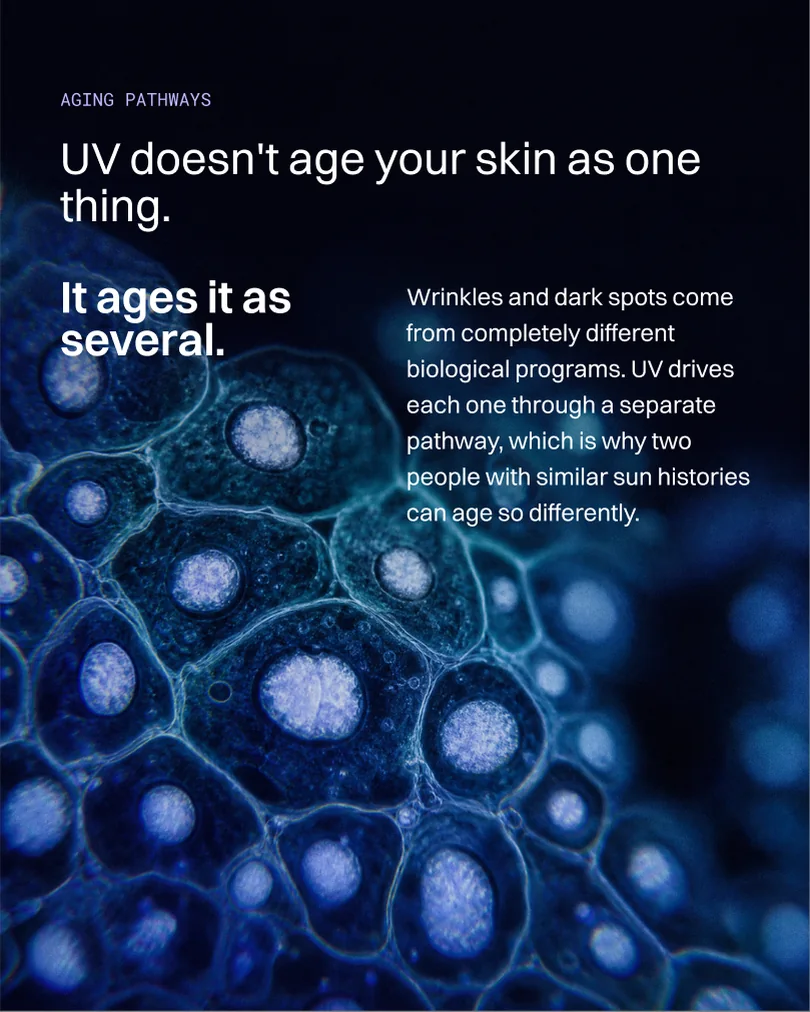
Carousel — UV damage doesn’t stop at the surface, slide 4
Carousel — UV damage doesn’t stop at the surface, slide 5
Carousel — UV damage doesn’t stop at the surface, slide 6
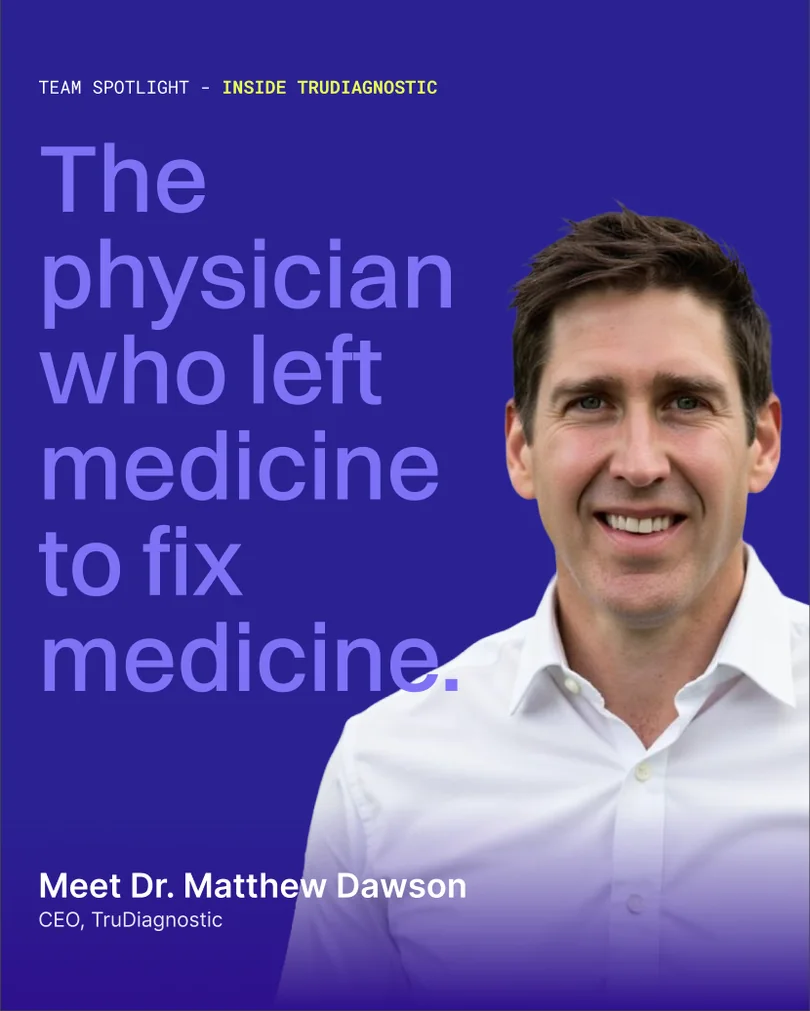
Carousel — Team spotlight — Dr. Matthew Dawson, slide 1
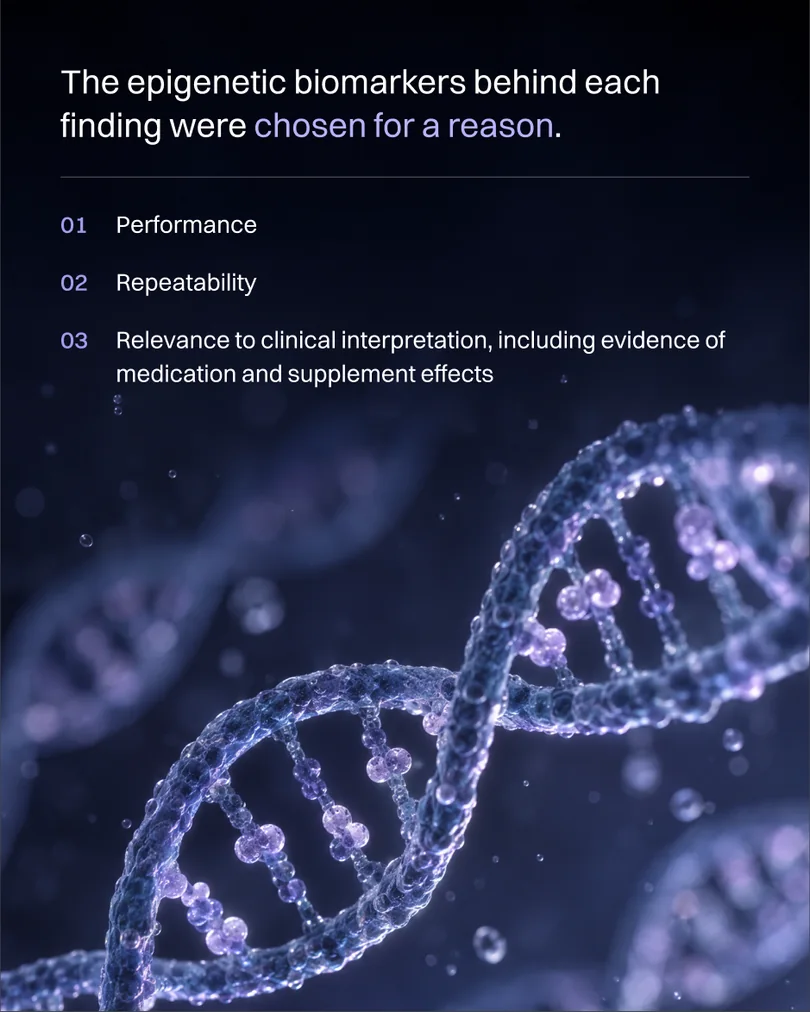
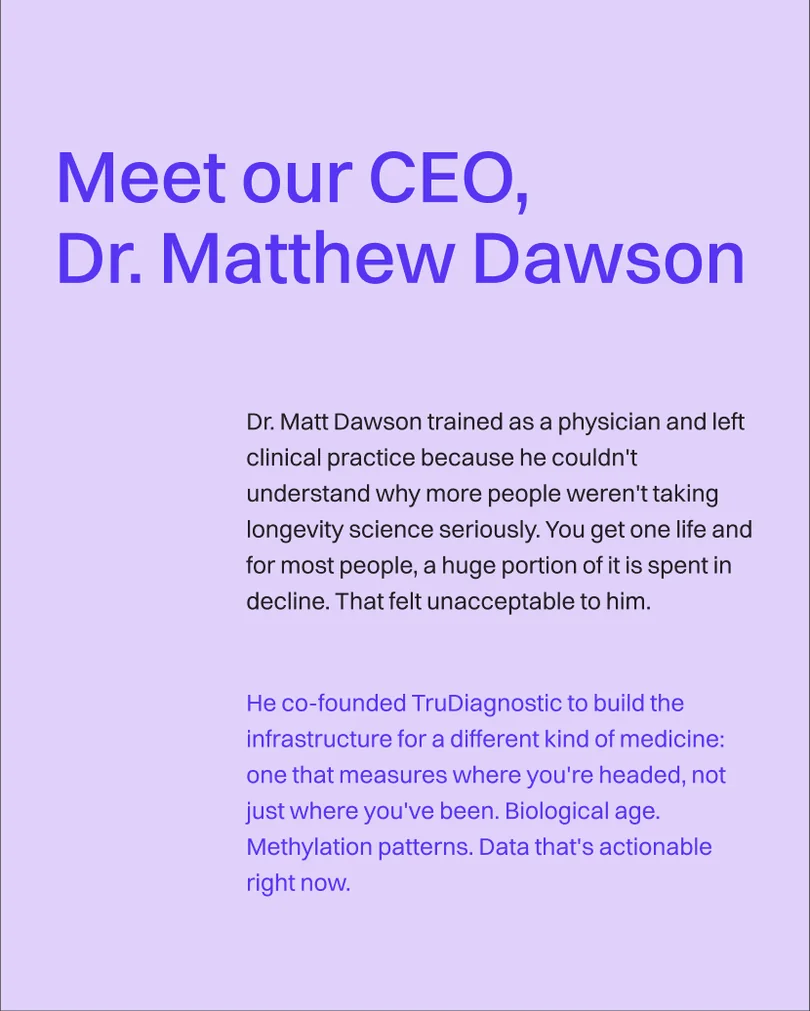
Carousel — Team spotlight — Dr. Matthew Dawson, slide 2
Carousel — Team spotlight — Dr. Matthew Dawson, slide 3
Carousel — Team spotlight — Dr. Matthew Dawson, slide 4
Carousel — Team spotlight — Dr. Matthew Dawson, slide 5
Carousel — Team spotlight — Dr. Matthew Dawson, slide 6
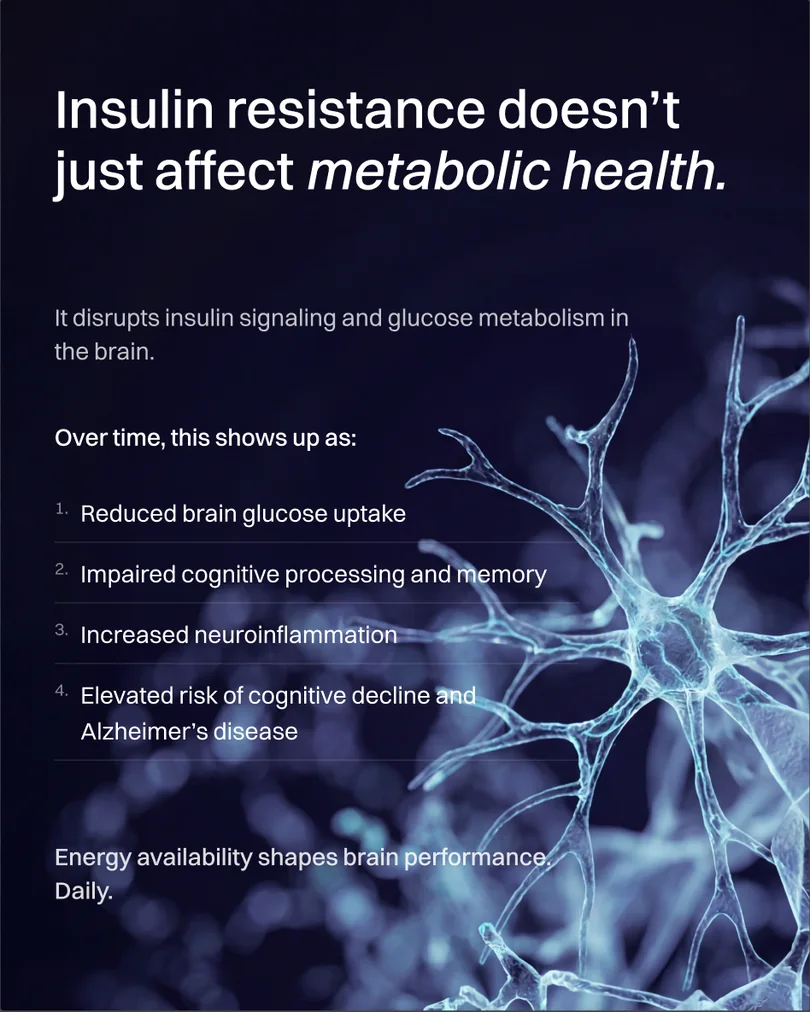
Carousel — 1 in 4 adults has insulin resistance, slide 1
Carousel — 1 in 4 adults has insulin resistance, slide 2
Carousel — 1 in 4 adults has insulin resistance, slide 3
Carousel — 1 in 4 adults has insulin resistance, slide 4
Carousel — 1 in 4 adults has insulin resistance, slide 5
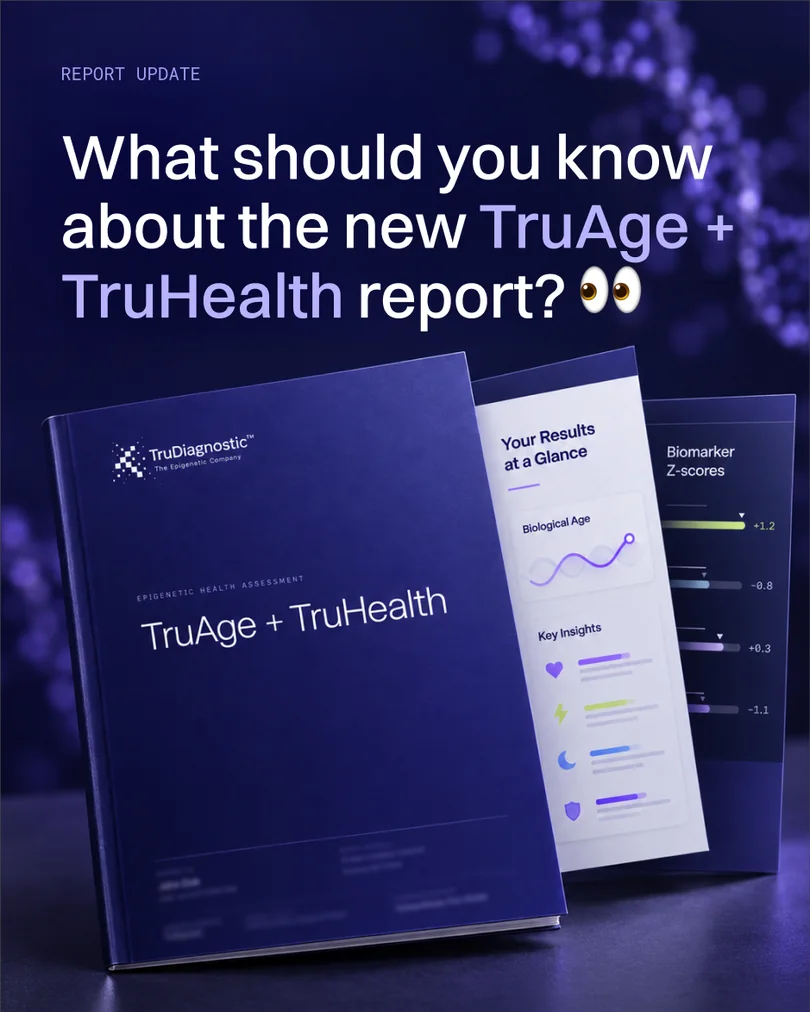
Carousel — What’s new in the TruAge + TruHealth report, slide 1
Carousel — What’s new in the TruAge + TruHealth report, slide 2
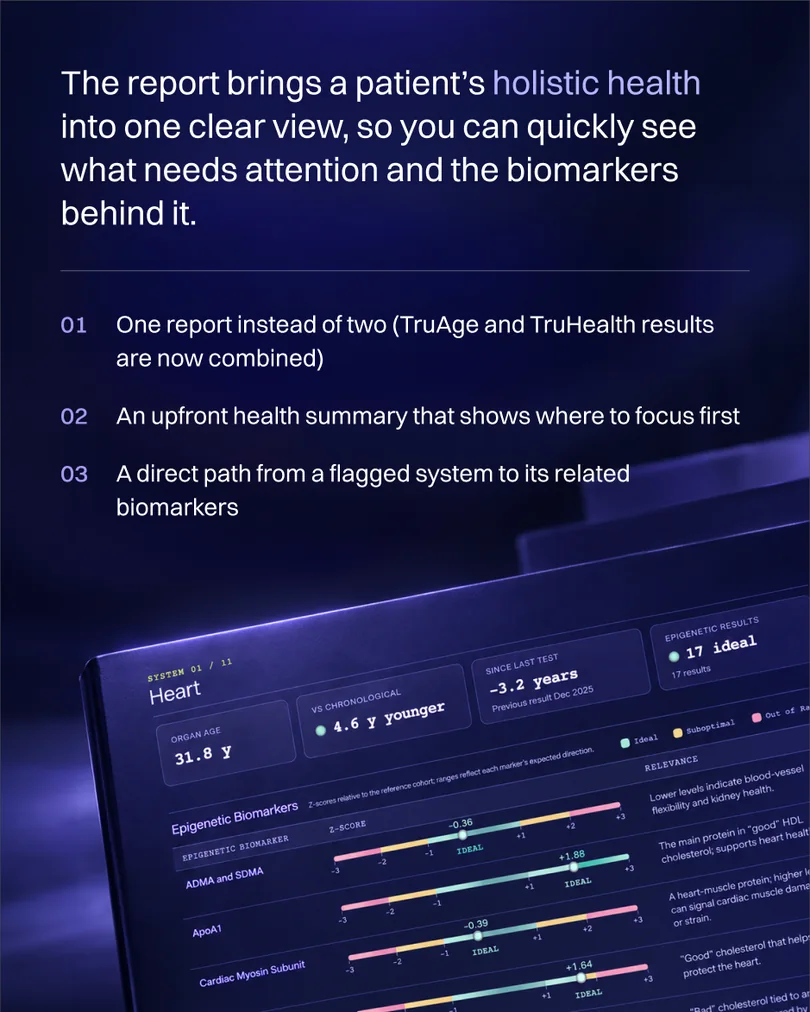
Carousel — What’s new in the TruAge + TruHealth report, slide 3
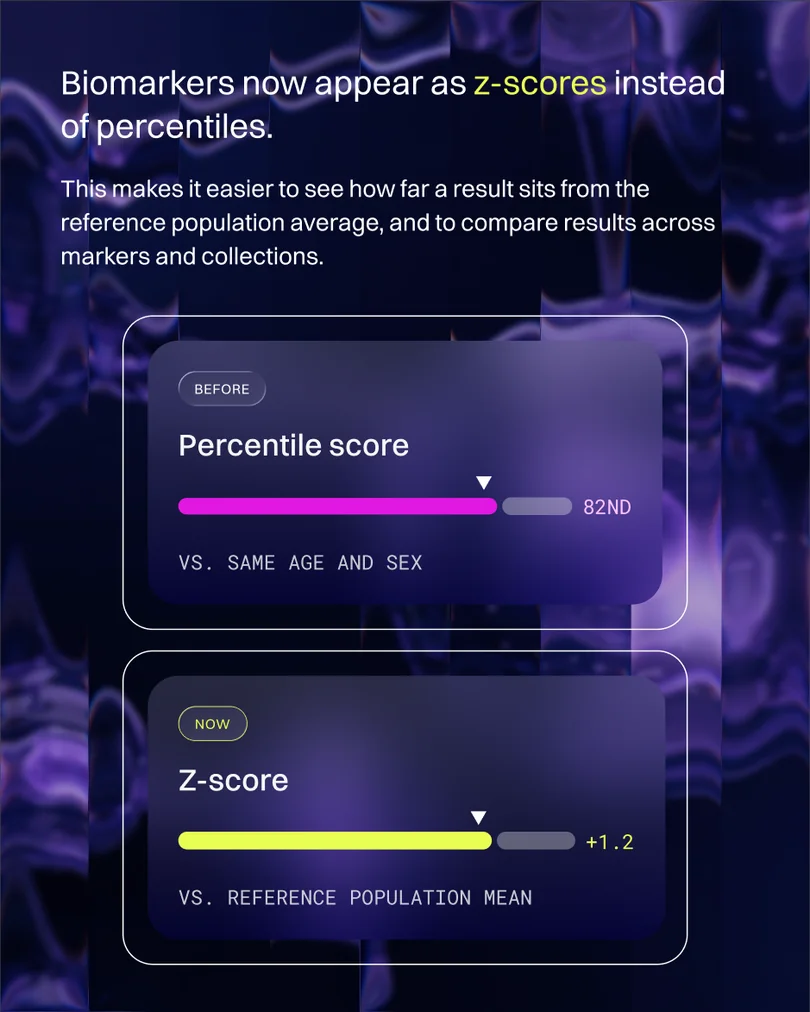
Carousel — What’s new in the TruAge + TruHealth report, slide 4
Carousel — What’s new in the TruAge + TruHealth report, slide 5
Carousel — IL-11 and longevity science, slide 1
Carousel — IL-11 and longevity science, slide 2
Carousel — IL-11 and longevity science, slide 3
Carousel — IL-11 and longevity science, slide 4
Carousel — IL-11 and longevity science, slide 5
Carousel — IL-11 and longevity science, slide 6

08

Conference & environments

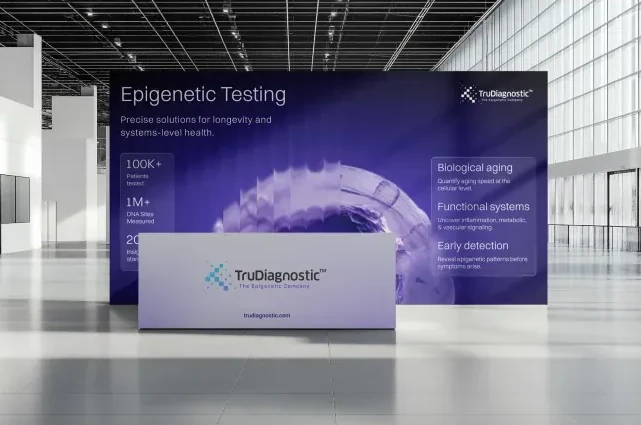
The system also needed to survive outside the screen — at scale, at a distance, on a busy show floor — while keeping its clarity and recognition.
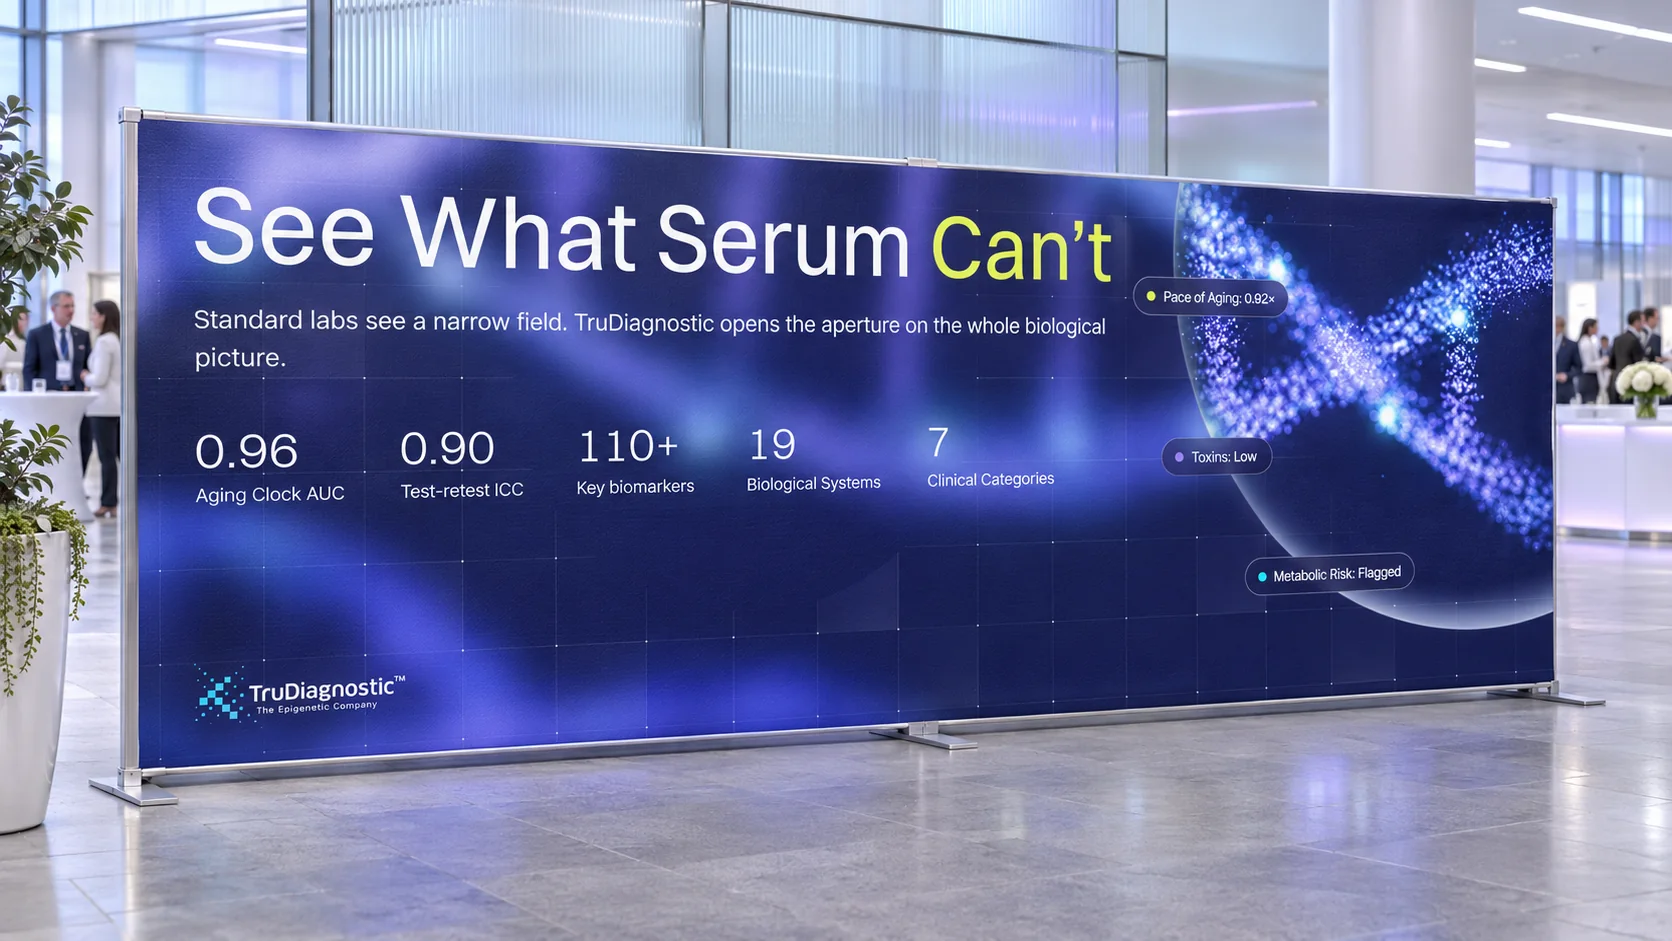
Exhibition backdrop — “See What Serum Can’t”

Exhibition backdrop — clinical longevity conference

Conference display — Epigenetic Testing
Conference display — data-led variant

Booths built to read from across the hall: bold gradients, scientific imagery and a clear hierarchy of headline, key stats and mark.

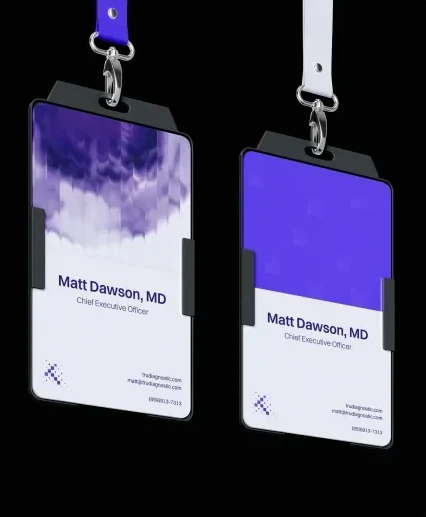
Cards, lanyards and folders carry the indigo palette and signal grid, so every first contact feels clinical but elevated.

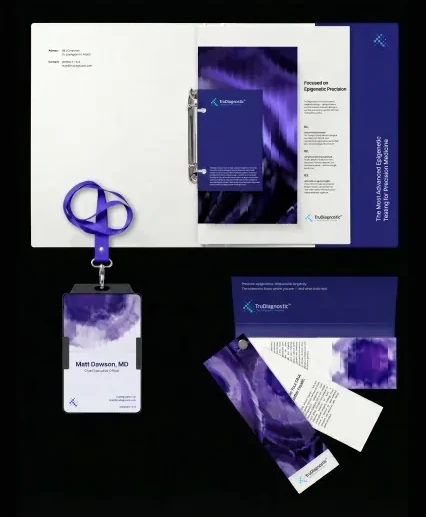
Business cards
Folder, badge and stationery suite
Event badges and lanyards

09 — One brand, many audiences

TruDiagnostic operates across consumer health, healthcare providers, scientific communication, and growth. The design system needed to flex across all of them without fragmenting into different brands.

The result is a more connected ecosystem — one visual language that moves from a paid ad to a provider conversation, a report, an email, or a conference floor.

Next case study

Infinite Epigenetics →
Elliakou...